INVITE-ONLY SCRIPT
Liquidity Rainbow - Trillion Research
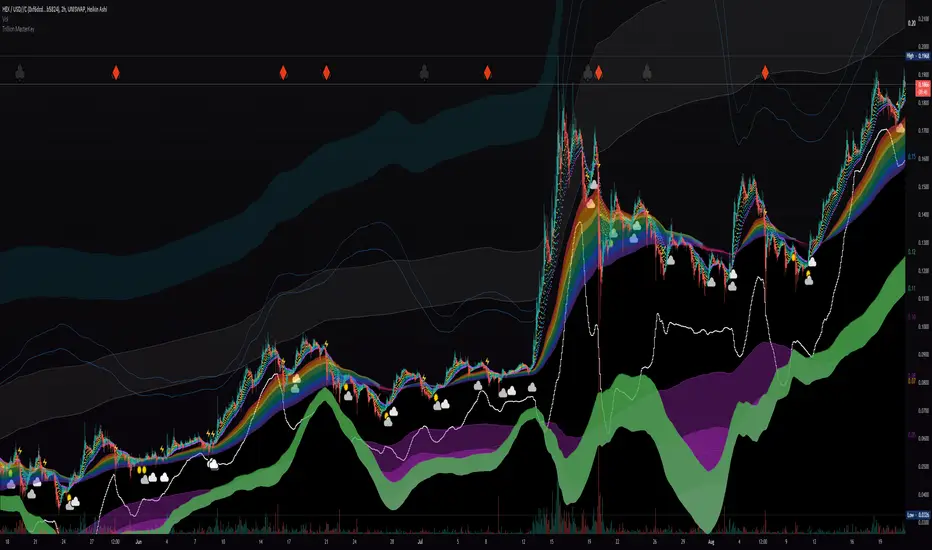
This indicator uses regression along with RSI and moving averages from multiple time frames to help you visualize the market in a single view. After learning the notations, you will be able to identify pockets of liquidity and determine high/low probability price zones without drawing a single line.
Booster symbols help confirm short term trends and breakouts based off of two waveform functions, one long period, the other with a much shorter period. You get the buy signal that everyone else sees plus the confirmation!
This is a system that is not fully developed, PNL is not available yet. Strategy version is coming soon, still back testing.
I am tuning this model for crypto specifically, although it works for anything with a price chart.
2 EMAs (configurable to MA)
Dragonskin - RGB circle plots eMA
Rainbow - RGB area plots eMA
+When you see the rainbow appear it means that the price is above the slowest ema baseline. Generally bullish as price tends to ride the rainbow. Ideally, you will see a white cloud at the origin.
-When you see white step line cutting into the upper colors of the rainbow.
Once the price has traded below the rainbow for the FIRST time, not just wicked. You can set a target that's just above the previous high bodys above the rainbow. Do not sell the dip, let the floppers flop.
The second time price cuts down through a thick rainbow is usually bearish .
What makes me so sure? Liquidity
In order to be successful, we need to understand liquidity, the juiciest pockets of profit.
I will reveal more of the strategy in the second script.
For now, use:
SUN symbol - Notice how the price always seems to come back and sweep up any SUNs that get left behind (up and down) this is a liquidity nugget
CLOUD(s) indicators of support. Meaning that on ema trend we expect a lower price but each time that happens, it gets bought up above baseline. weak->strong (little gray - light blue - white)
LIGHTNING indicator of resistance. Meaning the price is not being allowed to recover, each time it rises above baseline, it is sold down again.
YELLOW CROSS - Classically known as a whale manipulation indicator. It tends to indicate a strong bearish move incoming or the reversal of an ongoing bearish move. There's dumping. "Get ready something is happening" indicator.
HEARTS = BUY
SPADES = Buy
CLUBS = Sell
DIAMONDS = SELL
*do not use these during periods of consolidation. consolidation is a period when the price swings in both directions but not too much. In a narrow range the indicators can pop up.
Why does this happen?
Short periods, during which exchanges stabilize the prices, are necessary for the redistribution of assets over the course of trading. Sometimes they happen multiple times a week and can last 24 or 48hours. Also it is a great time to eat up algo traders and that's why you'll see noise.
You want to focus on the period immediately following a consolidations. Don't rush it, they really do take 20 hours+
If you realize that you are in one of these consolidation ranges, limit order the tips of the wicks, nothing in the middle. There is not much profit here but also there is minimal risk.
If you're confirmed in a consolidation, exchanges will work to buoy the price to the appropriate mark price even if there is a big buy/sell order. A lot of time price will go up the congruent amount afterwards to compensate the toxic vwap .
I hope this helps people see the bigger picture and become even more successful with bigger gains.
I've tested this on all the major cryptos. Bitcoin BTC Ethereum ETH HEX
Honestly, I have tested very few stonks with this, later.
-Market Enemy
초대 전용 스크립트
이 스크립트는 작성자가 승인한 사용자만 접근할 수 있습니다. 사용하려면 요청 후 승인을 받아야 하며, 일반적으로 결제 후에 허가가 부여됩니다. 자세한 내용은 아래 작성자의 안내를 따르거나 LunaMoons에게 직접 문의하세요.
트레이딩뷰는 스크립트의 작동 방식을 충분히 이해하고 작성자를 완전히 신뢰하지 않는 이상, 해당 스크립트에 비용을 지불하거나 사용하는 것을 권장하지 않습니다. 커뮤니티 스크립트에서 무료 오픈소스 대안을 찾아보실 수도 있습니다.
작성자 지시 사항
This script if free for a limited time, while I tune parameters. Please message me directly for access. There is an extension script, for enhanced trading symbols, coming soon!
면책사항
해당 정보와 게시물은 금융, 투자, 트레이딩 또는 기타 유형의 조언이나 권장 사항으로 간주되지 않으며, 트레이딩뷰에서 제공하거나 보증하는 것이 아닙니다. 자세한 내용은 이용 약관을 참조하세요.