OPEN-SOURCE SCRIPT
업데이트됨 Dollar Cost Averaging (YavuzAkbay)
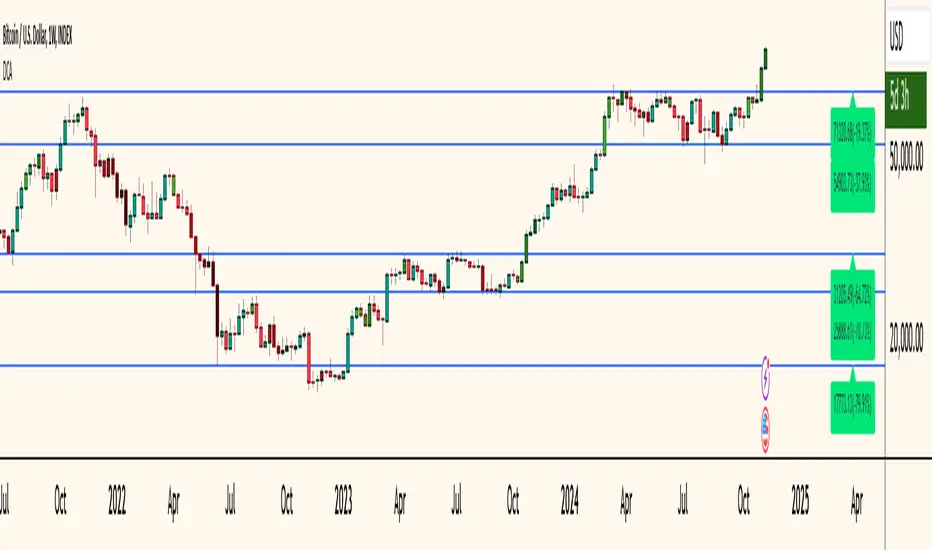
The Dollar Cost Averaging (DCA) indicator is designed to support long-term investors following a Dollar Cost Averaging strategy. The core aim of this tool is to provide insights into overbought and oversold levels, assisting investors in managing buy and sell decisions with a clear visual cue system. Specifically developed for use in trending or fluctuating markets, this indicator leverages support and resistance levels to give structure to investors' buying strategies. Here’s a detailed breakdown of the indicator’s key features and intended usage:
Key Features and Color Coding
Overbought/Oversold Detection:
Support and Resistance Levels:
Usage Methodology
This indicator is intended for Dollar Cost Averaging, a method where investors gradually add to their position rather than entering all at once. Here’s how it complements the DCA approach:
Customizable Settings
The DCA indicator offers several user-adjustable parameters:
Key Features and Color Coding
Overbought/Oversold Detection:
- The indicator shades candles from light green to dark green when an asset becomes increasingly overbought. Dark green signals indicate a peak, where the asset is overbought, suggesting a potential opportunity to take partial profits.
- Conversely, candles turn from light red to dark red when the market is oversold. Dark red signifies a heavily oversold condition, marking an ideal buying window for initiating or adding to a position. This color scheme provides a quick visual reference for investors to manage entries and exits effectively.
Support and Resistance Levels:
- To address the risk of assets falling further after an overbought signal, the DCA indicator dynamically calculates support and resistance levels. These levels guide investors on key price areas to watch for potential price reversals, allowing them to make more informed buying or selling decisions.
- Support levels help investors assess whether they should divide their capital across multiple buy orders, starting at the current oversold zone and extending to anticipated support zones for maximum flexibility.
Usage Methodology
This indicator is intended for Dollar Cost Averaging, a method where investors gradually add to their position rather than entering all at once. Here’s how it complements the DCA approach:
- Buy at Oversold Levels: When the indicator shows a dark red candle, it signals that the asset is oversold, marking an optimal entry point. The presence of support levels can help investors determine if they should fully invest their intended amount or stagger buys at potential lower levels.
- Sell at Overbought Levels: When the indicator transitions to dark green, it suggests that the asset is overbought. This is an ideal time to consider selling a portion of holdings to realize gains. The resistance levels, marked by the indicator, offer guidance on where the price may encounter selling pressure, aiding investors in planning partial exits.
Customizable Settings
The DCA indicator offers several user-adjustable parameters:
- Pivot Frequency and Source: Define the pivot point frequency and the source (candle wick or body) for more tailored support/resistance detection.
- Maximum Pivot Points: Set the maximum number of pivot points to be used in support/resistance calculations, providing flexibility in adapting to different market structures.
- Channel Width and Line Width: Adjust the width of the channel for support/resistance levels and the thickness of the lines for easier visual tracking.
- Color Intensities for Overbought/Oversold Levels: Customize the shading intensity for each overbought and oversold level to align with your trading preferences.
릴리즈 노트
- The indicator has been optimized by removing unnecessary code.
- The color of the labels has been changed to make them more readable.
- Labels have been brought closer to the final price.
오픈 소스 스크립트
트레이딩뷰의 진정한 정신에 따라, 이 스크립트의 작성자는 이를 오픈소스로 공개하여 트레이더들이 기능을 검토하고 검증할 수 있도록 했습니다. 작성자에게 찬사를 보냅니다! 이 코드는 무료로 사용할 수 있지만, 코드를 재게시하는 경우 하우스 룰이 적용된다는 점을 기억하세요.
면책사항
해당 정보와 게시물은 금융, 투자, 트레이딩 또는 기타 유형의 조언이나 권장 사항으로 간주되지 않으며, 트레이딩뷰에서 제공하거나 보증하는 것이 아닙니다. 자세한 내용은 이용 약관을 참조하세요.
오픈 소스 스크립트
트레이딩뷰의 진정한 정신에 따라, 이 스크립트의 작성자는 이를 오픈소스로 공개하여 트레이더들이 기능을 검토하고 검증할 수 있도록 했습니다. 작성자에게 찬사를 보냅니다! 이 코드는 무료로 사용할 수 있지만, 코드를 재게시하는 경우 하우스 룰이 적용된다는 점을 기억하세요.
면책사항
해당 정보와 게시물은 금융, 투자, 트레이딩 또는 기타 유형의 조언이나 권장 사항으로 간주되지 않으며, 트레이딩뷰에서 제공하거나 보증하는 것이 아닙니다. 자세한 내용은 이용 약관을 참조하세요.