PROTECTED SOURCE SCRIPT
Correlation Tracker - Joe v1
Correlation Tracker – Joe v1
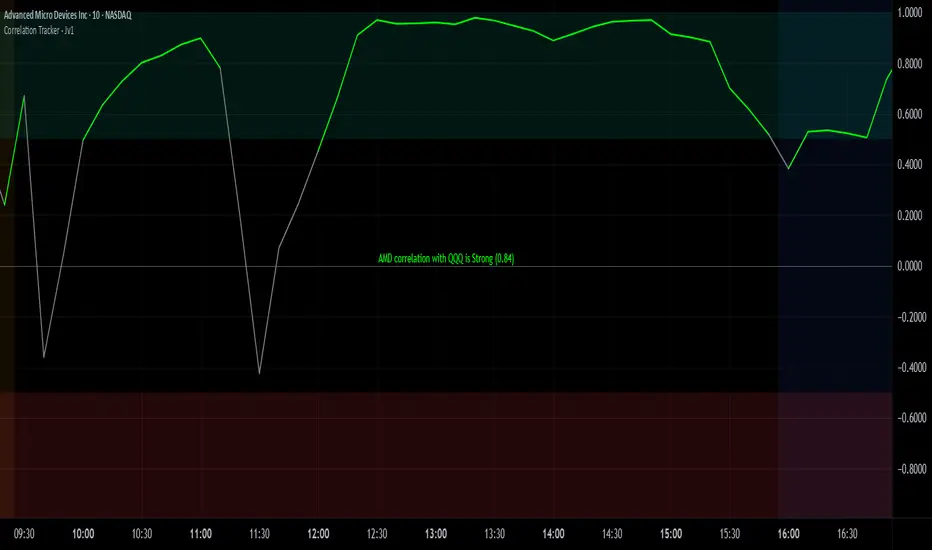
This indicator calculates the correlation between a selected ticker and an index over a user-defined period. It visualizes correlation with color-coded lines, thresholds, and a descriptive rating, helping traders quickly gauge the strength and direction of correlation.
________________________________________
Options and What They Do
General Settings
• Symbol: Select the ticker you want to analyze.
• Use Chart Symbol: If enabled, the script will use the symbol of the current chart instead of a manually selected symbol.
• Index: Choose the reference index or asset to compare the correlation against. Default is NASDAQ:QQQ.
• Length: Sets the number of periods used to calculate correlation via a moving average. Shorter lengths respond faster; longer lengths smooth correlation.
Correlation Rating Settings
• Show Correlation Rating: Display a textual description of correlation strength (e.g., Ultra Strong, Moderate, Weak).
• Position: Choose where the correlation rating table will appear on the chart (Top/Bottom, Left/Center/Right).
Correlation Line Settings
• Positive Color: Line color when correlation is above the positive threshold. Default: green.
• Negative Color: Line color when correlation is below the negative threshold. Default: red.
• Neutral Color: Line color when correlation is between thresholds. Default: gray.
Correlation Thresholds
• Positive – From: Minimum correlation value considered positive. Default: 0.5 (range 0–0.9).
• Positive Color BG: Background color fill for positive correlation range.
• Negative – From: Maximum correlation value considered negative. Default: -0.5 (range -0.9–0).
• Negative Color BG: Background color fill for negative correlation range.
________________________________________
How It Works
1. Calculates correlation between the selected ticker and the index using logarithmic returns.
2. Plots the correlation line with colors based on thresholds: positive (green), negative (red), neutral (gray).
3. Displays a correlation rating table showing strength (Ultra Weak → Ultra Strong) and absolute correlation on a 0–1 scale.
4. Allows customization of visual appearance, thresholds, and position of rating for clarity on any chart.
보호된 스크립트입니다
이 스크립트는 비공개 소스로 게시됩니다. 하지만 이를 자유롭게 제한 없이 사용할 수 있습니다 – 자세한 내용은 여기에서 확인하세요.
면책사항
해당 정보와 게시물은 금융, 투자, 트레이딩 또는 기타 유형의 조언이나 권장 사항으로 간주되지 않으며, 트레이딩뷰에서 제공하거나 보증하는 것이 아닙니다. 자세한 내용은 이용 약관을 참조하세요.
보호된 스크립트입니다
이 스크립트는 비공개 소스로 게시됩니다. 하지만 이를 자유롭게 제한 없이 사용할 수 있습니다 – 자세한 내용은 여기에서 확인하세요.
면책사항
해당 정보와 게시물은 금융, 투자, 트레이딩 또는 기타 유형의 조언이나 권장 사항으로 간주되지 않으며, 트레이딩뷰에서 제공하거나 보증하는 것이 아닙니다. 자세한 내용은 이용 약관을 참조하세요.