OPEN-SOURCE SCRIPT
Breakout Score (0–100)
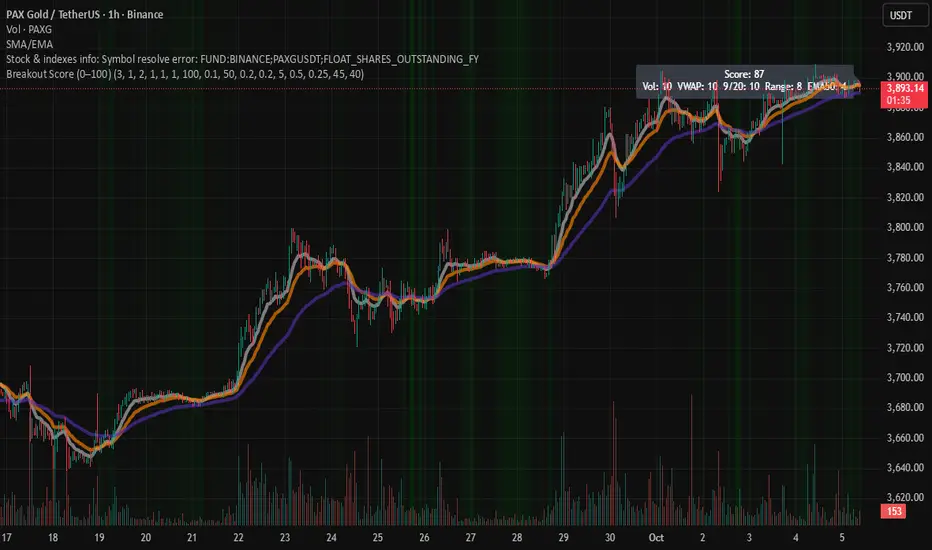
Breakouts are often the trader's best setups. Often seen on the chart as wedges and flags, consolidation before a pop up or down. This script attempts to visualize breakout potential with gradients in the background. I built this to place on my side charts to quickly visualize that a setup was forming.
For this indicator, Breakouts have generally been assumed as:
Decrease in average volume over N candles
Proximity to VWAP
Convergence/cross of price to the 9, 20 and 50 EMAs
Range compression (formation of flag or consolidation)
each of these factors are scored and rated. Multiple signals exponentially increase the gradient. Depending on the score, the chart will display a visual gradient behind the chart. Color, opacity and filtering fully customizable.
Enjoy!
오픈 소스 스크립트
트레이딩뷰의 진정한 정신에 따라, 이 스크립트의 작성자는 이를 오픈소스로 공개하여 트레이더들이 기능을 검토하고 검증할 수 있도록 했습니다. 작성자에게 찬사를 보냅니다! 이 코드는 무료로 사용할 수 있지만, 코드를 재게시하는 경우 하우스 룰이 적용된다는 점을 기억하세요.
면책사항
해당 정보와 게시물은 금융, 투자, 트레이딩 또는 기타 유형의 조언이나 권장 사항으로 간주되지 않으며, 트레이딩뷰에서 제공하거나 보증하는 것이 아닙니다. 자세한 내용은 이용 약관을 참조하세요.
오픈 소스 스크립트
트레이딩뷰의 진정한 정신에 따라, 이 스크립트의 작성자는 이를 오픈소스로 공개하여 트레이더들이 기능을 검토하고 검증할 수 있도록 했습니다. 작성자에게 찬사를 보냅니다! 이 코드는 무료로 사용할 수 있지만, 코드를 재게시하는 경우 하우스 룰이 적용된다는 점을 기억하세요.
면책사항
해당 정보와 게시물은 금융, 투자, 트레이딩 또는 기타 유형의 조언이나 권장 사항으로 간주되지 않으며, 트레이딩뷰에서 제공하거나 보증하는 것이 아닙니다. 자세한 내용은 이용 약관을 참조하세요.