INVITE-ONLY SCRIPT
업데이트됨 Killpips Acceleration
Dynamic action levels for tracking market reaction zones using a proprietary algorithm.
Settings
The acceleration value is automatically calculated every day. For a custom acceleration value, you can adjust it in the settings. Custom settings may be shared on the discord server if warranted. Setting this value to zero enables the auto-calculation.
Using the Indicator
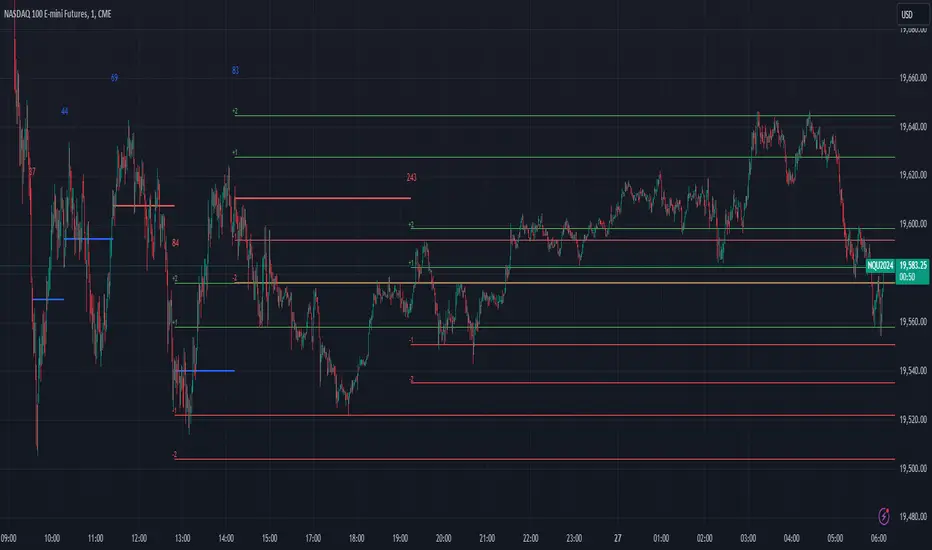
As data is received, the indicators adjusts it's calculation for the next action levels. Once the calculation is complete, a horizontal line is drawn as a decision price level. ATR levels are wrapped around the decision price level for additional reaction levels. As price approaches these levels, be cautious with your entries and exits while looking for price reactions. The calculated horizontal line can represent both support and resistance.
The shorter the calculated horizontal line, the stronger the reaction zone. As horizontal lines shift to higher prices, it indicates long market interest. Shorter lines with increasing price levels indicates a strong correlation to price change.
Generally, near the end of a segment, especially shorter segments, as the calculated horizontal line is drawn, we're looking for a market reaction.
Longer segments represent a slowdown in market activity with less reaction.
Settings
The acceleration value is automatically calculated every day. For a custom acceleration value, you can adjust it in the settings. Custom settings may be shared on the discord server if warranted. Setting this value to zero enables the auto-calculation.
Using the Indicator
As data is received, the indicators adjusts it's calculation for the next action levels. Once the calculation is complete, a horizontal line is drawn as a decision price level. ATR levels are wrapped around the decision price level for additional reaction levels. As price approaches these levels, be cautious with your entries and exits while looking for price reactions. The calculated horizontal line can represent both support and resistance.
The shorter the calculated horizontal line, the stronger the reaction zone. As horizontal lines shift to higher prices, it indicates long market interest. Shorter lines with increasing price levels indicates a strong correlation to price change.
Generally, near the end of a segment, especially shorter segments, as the calculated horizontal line is drawn, we're looking for a market reaction.
Longer segments represent a slowdown in market activity with less reaction.
릴리즈 노트
Added the ability to customize the color and styles초대 전용 스크립트
이 스크립트는 작성자가 승인한 사용자만 접근할 수 있습니다. 사용하려면 요청 후 승인을 받아야 하며, 일반적으로 결제 후에 허가가 부여됩니다. 자세한 내용은 아래 작성자의 안내를 따르거나 wmarkwilkinson에게 직접 문의하세요.
이 비공개 초대 전용 스크립트는 스크립트 모더레이터의 검토를 거치지 않았으며, 하우스 룰 준수 여부는 확인되지 않았습니다. 트레이딩뷰는 스크립트의 작동 방식을 충분히 이해하고 작성자를 완전히 신뢰하지 않는 이상, 해당 스크립트에 비용을 지불하거나 사용하는 것을 권장하지 않습니다. 커뮤니티 스크립트에서 무료 오픈소스 대안을 찾아보실 수도 있습니다.
작성자 지시 사항
This indicator is available for members of the discord server.
면책사항
해당 정보와 게시물은 금융, 투자, 트레이딩 또는 기타 유형의 조언이나 권장 사항으로 간주되지 않으며, 트레이딩뷰에서 제공하거나 보증하는 것이 아닙니다. 자세한 내용은 이용 약관을 참조하세요.
초대 전용 스크립트
이 스크립트는 작성자가 승인한 사용자만 접근할 수 있습니다. 사용하려면 요청 후 승인을 받아야 하며, 일반적으로 결제 후에 허가가 부여됩니다. 자세한 내용은 아래 작성자의 안내를 따르거나 wmarkwilkinson에게 직접 문의하세요.
이 비공개 초대 전용 스크립트는 스크립트 모더레이터의 검토를 거치지 않았으며, 하우스 룰 준수 여부는 확인되지 않았습니다. 트레이딩뷰는 스크립트의 작동 방식을 충분히 이해하고 작성자를 완전히 신뢰하지 않는 이상, 해당 스크립트에 비용을 지불하거나 사용하는 것을 권장하지 않습니다. 커뮤니티 스크립트에서 무료 오픈소스 대안을 찾아보실 수도 있습니다.
작성자 지시 사항
This indicator is available for members of the discord server.
면책사항
해당 정보와 게시물은 금융, 투자, 트레이딩 또는 기타 유형의 조언이나 권장 사항으로 간주되지 않으며, 트레이딩뷰에서 제공하거나 보증하는 것이 아닙니다. 자세한 내용은 이용 약관을 참조하세요.