OPEN-SOURCE SCRIPT
업데이트됨 Previous Day Week Highs & Lows
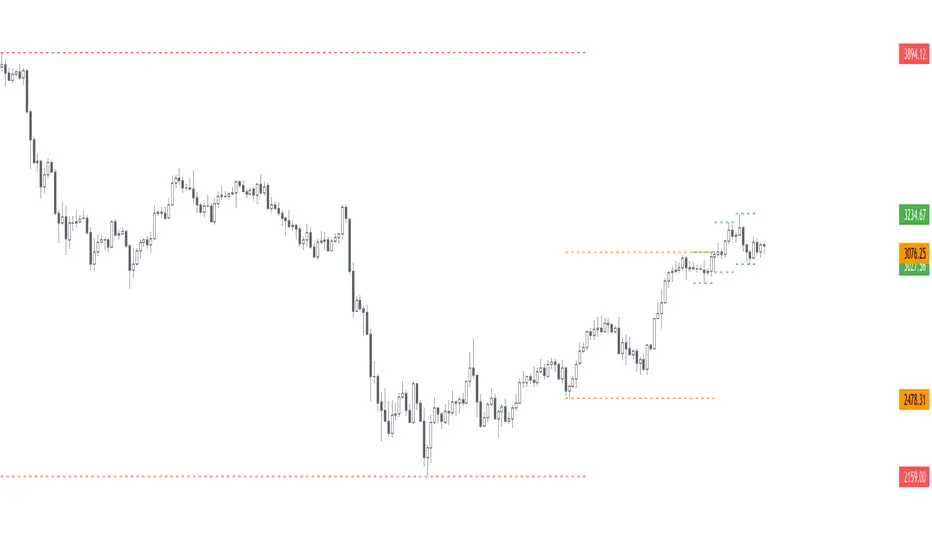
This script plots the previous n day and week highs and lows (previous two days and previous week by default).
Here are some additional info about the script behavior:
Here are some additional info about the script behavior:
- Plots highs and/or lows
- Plots for days and/or weeks
- Day highs and lows are shown only on intraday timeframes
- Week highs and lows are shown only on timeframes < weekly
릴리즈 노트
- Add previous month(s) high(s) and low(s)
- Minor fixes and improvements
오픈 소스 스크립트
트레이딩뷰의 진정한 정신에 따라, 이 스크립트의 작성자는 이를 오픈소스로 공개하여 트레이더들이 기능을 검토하고 검증할 수 있도록 했습니다. 작성자에게 찬사를 보냅니다! 이 코드는 무료로 사용할 수 있지만, 코드를 재게시하는 경우 하우스 룰이 적용된다는 점을 기억하세요.
🌟 Listed as "Trusted Pine Programmer"
👨💻 Coding services: sbtnc.dev/hire-pine-script-developer
🔒 Premium indicators: sbtnc.gumroad.com
☕️ Tip: buymeacoffee.com/sbtnc
👨💻 Coding services: sbtnc.dev/hire-pine-script-developer
🔒 Premium indicators: sbtnc.gumroad.com
☕️ Tip: buymeacoffee.com/sbtnc
면책사항
해당 정보와 게시물은 금융, 투자, 트레이딩 또는 기타 유형의 조언이나 권장 사항으로 간주되지 않으며, 트레이딩뷰에서 제공하거나 보증하는 것이 아닙니다. 자세한 내용은 이용 약관을 참조하세요.