OPEN-SOURCE SCRIPT
업데이트됨 Market Cap / Revenue Ratio
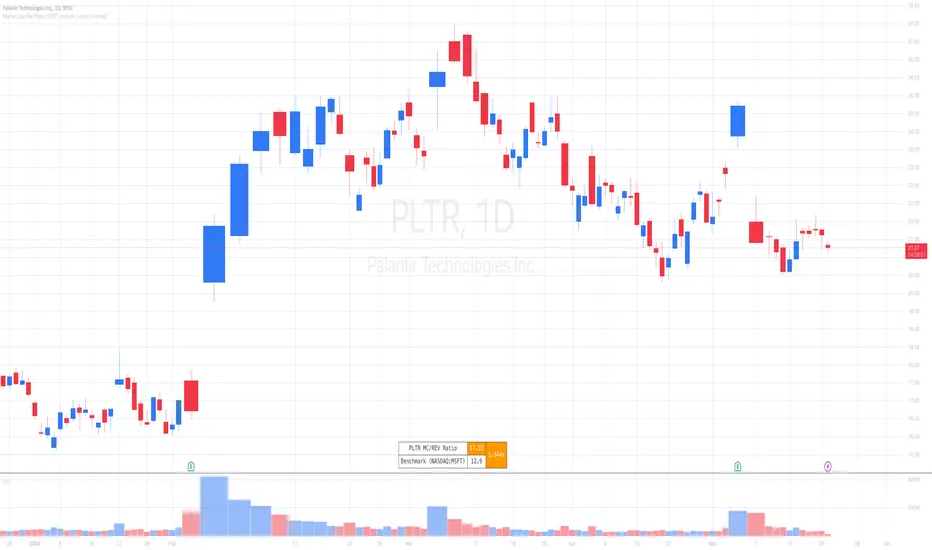
A variation of the P/S ratio, this script takes the future estimated revenue of the current stock versus it's Market Cap. It then compares the aforementioned Market Cap:Revenue ratio against a market bellwether's corresponding ratio (MSFT by default) to determine the following:
- Light green when the ratio is extremely low (Stock is very undervalued)
- Green when the ratio is low (Stock's multiple is lower by 20-50%)
- Blue when the ratio is close to the benchmark (Stock is fairly valued to benchmark multiple)
- Red when the ratio is high (Stock's mulitple is higher by 50% or more)
- Dark red when the ratio is extremely high (Stock is very overvalued)
CONFIGURABLE
- Full Table: Show the entire calculation table
- Minimalist: Go minimal and show only the ratio and color code
- Show Benchmark Multiple: Show the multiple ratio calculated between the current stock and the benchmark stock (MSFT by default)
NOTES
- When calculating the Market Cap, TradingView sometimes under-reports the number of shares and thus skews the Market Cap too low. This seems to happen for stocks with multiple share classes like GOOGL so be mindful that the data can be wrong for these kinds of stocks. You can check on this by going into the Indicator's Settings and select Show Full Table which will show the number of shares outstanding reported by TradingView.
- For certain stocks such as foreign ADRs, there won't be a future revenue estimate so the script will automatically use the Total Revenue for the most recent Quarter in these cases
릴리즈 노트
Code cleanup / added more comments. Chart update.오픈 소스 스크립트
트레이딩뷰의 진정한 정신에 따라, 이 스크립트의 작성자는 이를 오픈소스로 공개하여 트레이더들이 기능을 검토하고 검증할 수 있도록 했습니다. 작성자에게 찬사를 보냅니다! 이 코드는 무료로 사용할 수 있지만, 코드를 재게시하는 경우 하우스 룰이 적용된다는 점을 기억하세요.
면책사항
해당 정보와 게시물은 금융, 투자, 트레이딩 또는 기타 유형의 조언이나 권장 사항으로 간주되지 않으며, 트레이딩뷰에서 제공하거나 보증하는 것이 아닙니다. 자세한 내용은 이용 약관을 참조하세요.
오픈 소스 스크립트
트레이딩뷰의 진정한 정신에 따라, 이 스크립트의 작성자는 이를 오픈소스로 공개하여 트레이더들이 기능을 검토하고 검증할 수 있도록 했습니다. 작성자에게 찬사를 보냅니다! 이 코드는 무료로 사용할 수 있지만, 코드를 재게시하는 경우 하우스 룰이 적용된다는 점을 기억하세요.
면책사항
해당 정보와 게시물은 금융, 투자, 트레이딩 또는 기타 유형의 조언이나 권장 사항으로 간주되지 않으며, 트레이딩뷰에서 제공하거나 보증하는 것이 아닙니다. 자세한 내용은 이용 약관을 참조하세요.