OPEN-SOURCE SCRIPT
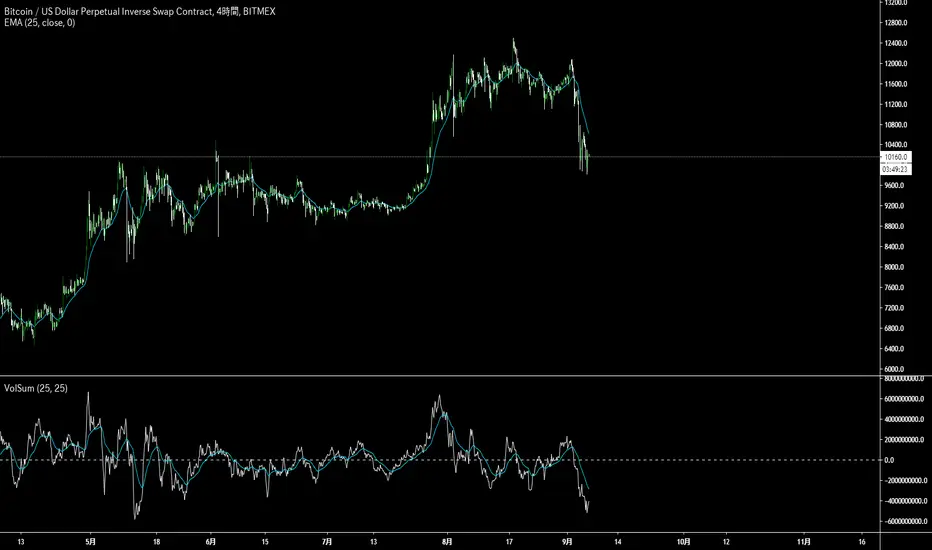
VolSum

Google Translation------------------------------------------------------------------------------------------------------------------------------------------
If the closing price is higher than the opening price, the volume is positive and reverse.
If the closing price is smaller than the opening price, the volume is negative and their defined period
It is an indicator that I thought that I would like to see how the shape changes compared to the price chart
when the sum of is calculated.
The white line is the sum of the output and the light blue line is the white line ema.
日本語---------------------------------------------------------------------------------------------------------------------------------------------------------
終値が始値より大きければ出来高をプラスに逆である終値が始値より小さければ出来高をマイナスにしそれらの定められた期間
の合計(sum)を出したら価格チャートと比較して形がどのように変化するか見てみたいと思い作ったインジケーターです。
白い線が出来高のsumで水色の線は白い線のemaになります。
오픈 소스 스크립트
트레이딩뷰의 진정한 정신에 따라, 이 스크립트의 작성자는 이를 오픈소스로 공개하여 트레이더들이 기능을 검토하고 검증할 수 있도록 했습니다. 작성자에게 찬사를 보냅니다! 이 코드는 무료로 사용할 수 있지만, 코드를 재게시하는 경우 하우스 룰이 적용된다는 점을 기억하세요.
면책사항
해당 정보와 게시물은 금융, 투자, 트레이딩 또는 기타 유형의 조언이나 권장 사항으로 간주되지 않으며, 트레이딩뷰에서 제공하거나 보증하는 것이 아닙니다. 자세한 내용은 이용 약관을 참조하세요.
오픈 소스 스크립트
트레이딩뷰의 진정한 정신에 따라, 이 스크립트의 작성자는 이를 오픈소스로 공개하여 트레이더들이 기능을 검토하고 검증할 수 있도록 했습니다. 작성자에게 찬사를 보냅니다! 이 코드는 무료로 사용할 수 있지만, 코드를 재게시하는 경우 하우스 룰이 적용된다는 점을 기억하세요.
면책사항
해당 정보와 게시물은 금융, 투자, 트레이딩 또는 기타 유형의 조언이나 권장 사항으로 간주되지 않으며, 트레이딩뷰에서 제공하거나 보증하는 것이 아닙니다. 자세한 내용은 이용 약관을 참조하세요.