OPEN-SOURCE SCRIPT
MTF TTM Squeeze Pro
Overview
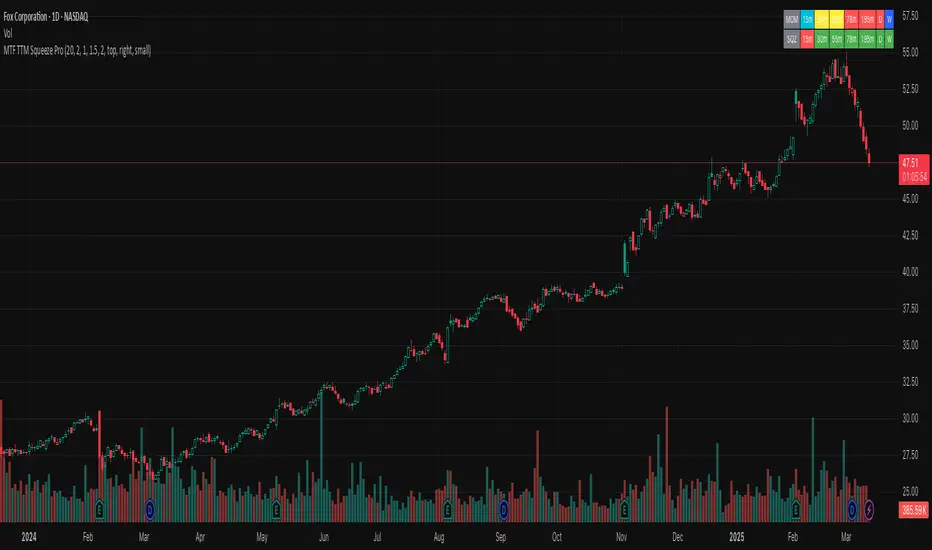
The MTF TTM Squeeze Pro indicator helps traders identify market compression (squeeze) conditions and analyze momentum across multiple timeframes. It is based on the TTM Squeeze concept, which uses Bollinger Bands and Keltner Channels to detect price consolidation periods that often precede strong breakouts.
This script enhances the standard TTM Squeeze by providing a multi-timeframe view, allowing traders to assess market conditions across intraday, daily, and weekly charts simultaneously.
⸻
How It Works
1. Squeeze Detection using Bollinger Bands & Keltner Channels
• High Compression Squeeze (Orange): Strongest squeeze, indicating extreme consolidation.
• Medium Compression Squeeze (Red): Moderate squeeze, potential breakout setup.
• Low Compression Squeeze (Black): Mild squeeze, possible momentum shift.
• No Squeeze (Green): Market is trending, no consolidation detected.
2. Momentum Analysis
The script features a custom linear regression momentum oscillator to gauge market direction:
• Positive rising momentum (Aqua) suggests bullish acceleration.
• Positive falling momentum (Blue) indicates slowing bullish momentum.
• Negative rising momentum (Red) signals bearish weakening.
• Negative falling momentum (Yellow) represents strengthening bearish momentum.
3. Multi-Timeframe Display
The indicator provides a table panel showing squeeze conditions and momentum colors for:
✅ 15m, 30m, 55m, 78m, 195m, Daily (D), and Weekly (W) timeframes.
This makes it easier to spot confluences across different periods, helping traders align their entries with larger trends.
⸻
How to Use
✔️ Look for a high compression squeeze (orange dots) as potential breakout zones.
✔️ Check if momentum colors are aligned across multiple timeframes to confirm direction.
✔️ Trade in the direction of momentum once the squeeze is released.
Best Used For:
📈 Swing Trading – Identify multi-day setups using the D/W squeeze signals.
📉 Intraday Trading – Use 15m-78m signals for faster entries and exits.
⸻
Credits & Open-Source Compliance
This script is inspired by the original TTM Squeeze Pro and based on open-source contributions from the TradingView community. Significant modifications include:
✔️ Improved multi-timeframe data request for momentum & squeeze.
✔️ Enhanced visual display with a compact and informative table panel.
✔️ Added detailed documentation for better usability.
📌 Original Source: TradingView Script by Beardy_Fred

⸻
Final Notes
✅ Designed for stocks, forex, and crypto.
✅ Fully customizable squeeze & momentum settings.
Enjoy trading, and may the squeeze be with you! 🚀
The MTF TTM Squeeze Pro indicator helps traders identify market compression (squeeze) conditions and analyze momentum across multiple timeframes. It is based on the TTM Squeeze concept, which uses Bollinger Bands and Keltner Channels to detect price consolidation periods that often precede strong breakouts.
This script enhances the standard TTM Squeeze by providing a multi-timeframe view, allowing traders to assess market conditions across intraday, daily, and weekly charts simultaneously.
⸻
How It Works
1. Squeeze Detection using Bollinger Bands & Keltner Channels
• High Compression Squeeze (Orange): Strongest squeeze, indicating extreme consolidation.
• Medium Compression Squeeze (Red): Moderate squeeze, potential breakout setup.
• Low Compression Squeeze (Black): Mild squeeze, possible momentum shift.
• No Squeeze (Green): Market is trending, no consolidation detected.
2. Momentum Analysis
The script features a custom linear regression momentum oscillator to gauge market direction:
• Positive rising momentum (Aqua) suggests bullish acceleration.
• Positive falling momentum (Blue) indicates slowing bullish momentum.
• Negative rising momentum (Red) signals bearish weakening.
• Negative falling momentum (Yellow) represents strengthening bearish momentum.
3. Multi-Timeframe Display
The indicator provides a table panel showing squeeze conditions and momentum colors for:
✅ 15m, 30m, 55m, 78m, 195m, Daily (D), and Weekly (W) timeframes.
This makes it easier to spot confluences across different periods, helping traders align their entries with larger trends.
⸻
How to Use
✔️ Look for a high compression squeeze (orange dots) as potential breakout zones.
✔️ Check if momentum colors are aligned across multiple timeframes to confirm direction.
✔️ Trade in the direction of momentum once the squeeze is released.
Best Used For:
📈 Swing Trading – Identify multi-day setups using the D/W squeeze signals.
📉 Intraday Trading – Use 15m-78m signals for faster entries and exits.
⸻
Credits & Open-Source Compliance
This script is inspired by the original TTM Squeeze Pro and based on open-source contributions from the TradingView community. Significant modifications include:
✔️ Improved multi-timeframe data request for momentum & squeeze.
✔️ Enhanced visual display with a compact and informative table panel.
✔️ Added detailed documentation for better usability.
📌 Original Source: TradingView Script by Beardy_Fred
⸻
Final Notes
✅ Designed for stocks, forex, and crypto.
✅ Fully customizable squeeze & momentum settings.
Enjoy trading, and may the squeeze be with you! 🚀
오픈 소스 스크립트
트레이딩뷰의 진정한 정신에 따라, 이 스크립트의 작성자는 이를 오픈소스로 공개하여 트레이더들이 기능을 검토하고 검증할 수 있도록 했습니다. 작성자에게 찬사를 보냅니다! 이 코드는 무료로 사용할 수 있지만, 코드를 재게시하는 경우 하우스 룰이 적용된다는 점을 기억하세요.
면책사항
해당 정보와 게시물은 금융, 투자, 트레이딩 또는 기타 유형의 조언이나 권장 사항으로 간주되지 않으며, 트레이딩뷰에서 제공하거나 보증하는 것이 아닙니다. 자세한 내용은 이용 약관을 참조하세요.
오픈 소스 스크립트
트레이딩뷰의 진정한 정신에 따라, 이 스크립트의 작성자는 이를 오픈소스로 공개하여 트레이더들이 기능을 검토하고 검증할 수 있도록 했습니다. 작성자에게 찬사를 보냅니다! 이 코드는 무료로 사용할 수 있지만, 코드를 재게시하는 경우 하우스 룰이 적용된다는 점을 기억하세요.
면책사항
해당 정보와 게시물은 금융, 투자, 트레이딩 또는 기타 유형의 조언이나 권장 사항으로 간주되지 않으며, 트레이딩뷰에서 제공하거나 보증하는 것이 아닙니다. 자세한 내용은 이용 약관을 참조하세요.