PROTECTED SOURCE SCRIPT
업데이트됨 Trend Strength Indicator
How to use?
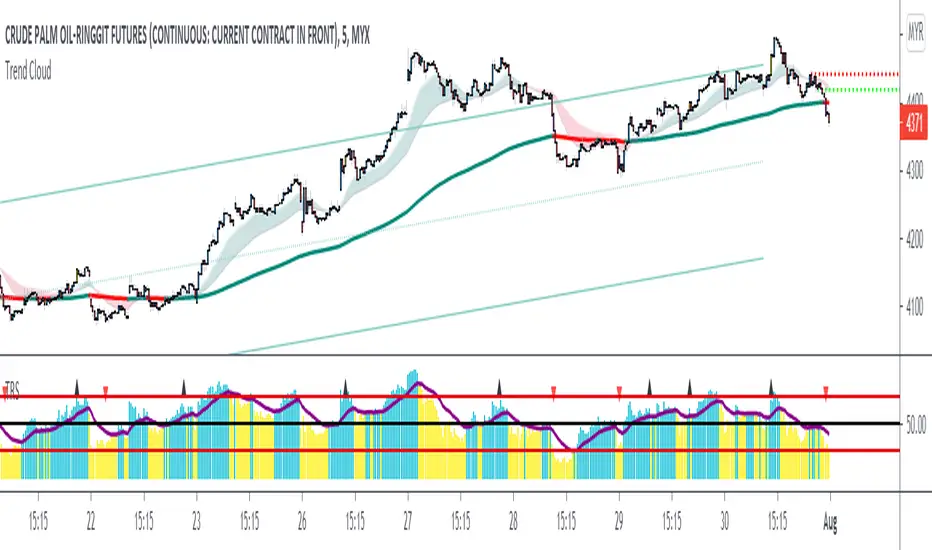
1) The purple line summarizes the overall trend strength.
If the purple line is above 50, the market is considered to be bullish
If the purple line is below 50, the market is then considered to be bearish
Buy-Long position can be considered when the purple line is crossing up the 50-line and exit-long position can be considered vice versa.
However it is best to let the purple line to test the 50 line after crossing.
2) Each bar represents the each price movement strength index.
If the bar is above the purple line, the bar's color will become blue, indicating that the price is gaining momentum.
If the bar is below the purple line, the bar's color will turn to yellow, indicating the prices is losing momentum.
Default setting is period : 20, average : 20. It can be customized based on trading style and risk tolerance.
릴리즈 노트
Changed default setting from 20/20 to 14/14Change lower base from 20 to 0
릴리즈 노트
Adjusted the precision for divergence 릴리즈 노트
1) Updated calculation coding and default setting (14/14 to 14/20) to reduce noise2) Add up color bar coding. When Average line crosses up 50 line, bar color will turn to yellow and turns to purple when crosses down 50-line
릴리즈 노트
1) Updated name from Trend Strength Indicator to Trend Relative Strength2) Introduced input for average up & average down control
보호된 스크립트입니다
이 스크립트는 비공개 소스로 게시됩니다. 하지만 이를 자유롭게 제한 없이 사용할 수 있습니다 – 자세한 내용은 여기에서 확인하세요.
면책사항
해당 정보와 게시물은 금융, 투자, 트레이딩 또는 기타 유형의 조언이나 권장 사항으로 간주되지 않으며, 트레이딩뷰에서 제공하거나 보증하는 것이 아닙니다. 자세한 내용은 이용 약관을 참조하세요.
면책사항
해당 정보와 게시물은 금융, 투자, 트레이딩 또는 기타 유형의 조언이나 권장 사항으로 간주되지 않으며, 트레이딩뷰에서 제공하거나 보증하는 것이 아닙니다. 자세한 내용은 이용 약관을 참조하세요.