OPEN-SOURCE SCRIPT
업데이트됨 trend judgment & multi ma
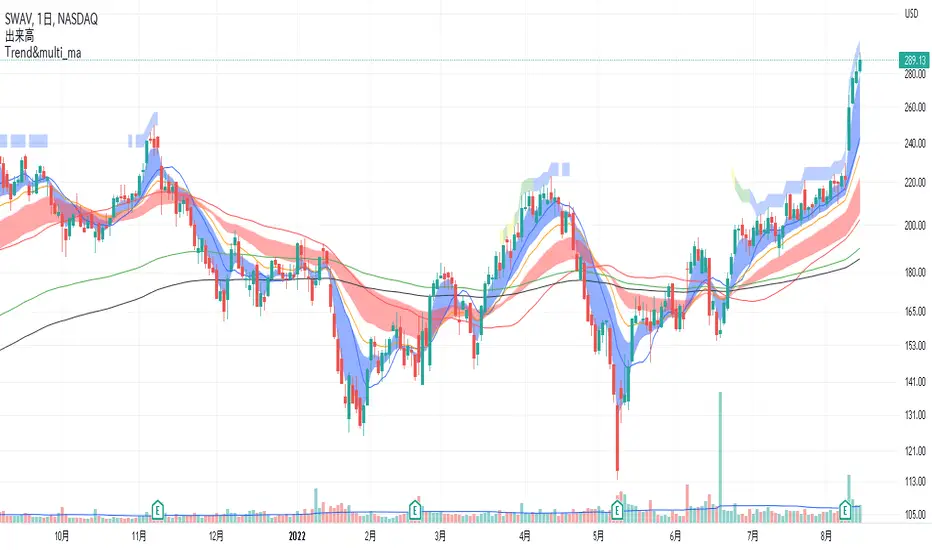
1 The background is filled with the number of matches to the trend template.
For the following conditions, 7 matches are yellow, 8 matches are green, and 9 matches are blue.
1. the stock price is above the 150-day MA and 200-day MA
2. the 50-day MA is above the 200-day MA
3. 200-day MA is in an uptrend for at least one month
4. 50-day MA is above 150-day MA and 200-day MA
5. stock price is 25% or more above 52-week low
6. stock price is 0 - 25% below 52-week high
7. IBD RS is above 70, preferably in the 90s → I don't know the exact formula, so I'm approximating with a formula that gives similar values.
8. when the stock is breaking above the base, the stock price is above the 50MA → It is difficult to judge the base itself, so it is not included in the conditions.
9. volume is high during an upward and low during a downward → volume during an upward > volume during a downward in the past 20 periods.
ex1. the 5-day MA is above the 20-day MA.
2 multi moving averages are shown.
릴리즈 노트
1 The background is filled with the number of matches to the trend template.For the following conditions, 7 matches are yellow, 8 matches are green, and 9 matches are blue.
1. the stock price is above the 150-day MA and 200-day MA
2. the 150-day MA is above the 200-day MA
3. 200-day MA is in an uptrend for at least one month
4. 50-day MA is above 150-day MA and 200-day MA
5. stock price is 25% or more above 52-week low
6. stock price is 0 - 25% below 52-week high
7. IBD RS is above 70, preferably in the 90s → I don't know the exact formula, so I'm approximating with a formula that gives similar values.
8. when the stock is breaking above the base, the stock price is above the 50MA → It is difficult to judge the base itself, so it is not included in the conditions.
9. volume is high during an upward and low during a downward → volume during an upward > volume during a downward in the past 20 periods.
ex1 . the 5-day MA is above the 20-day MA.
2 multi moving averages are shown.
오픈 소스 스크립트
트레이딩뷰의 진정한 정신에 따라, 이 스크립트의 작성자는 이를 오픈소스로 공개하여 트레이더들이 기능을 검토하고 검증할 수 있도록 했습니다. 작성자에게 찬사를 보냅니다! 이 코드는 무료로 사용할 수 있지만, 코드를 재게시하는 경우 하우스 룰이 적용된다는 점을 기억하세요.
면책사항
해당 정보와 게시물은 금융, 투자, 트레이딩 또는 기타 유형의 조언이나 권장 사항으로 간주되지 않으며, 트레이딩뷰에서 제공하거나 보증하는 것이 아닙니다. 자세한 내용은 이용 약관을 참조하세요.
오픈 소스 스크립트
트레이딩뷰의 진정한 정신에 따라, 이 스크립트의 작성자는 이를 오픈소스로 공개하여 트레이더들이 기능을 검토하고 검증할 수 있도록 했습니다. 작성자에게 찬사를 보냅니다! 이 코드는 무료로 사용할 수 있지만, 코드를 재게시하는 경우 하우스 룰이 적용된다는 점을 기억하세요.
면책사항
해당 정보와 게시물은 금융, 투자, 트레이딩 또는 기타 유형의 조언이나 권장 사항으로 간주되지 않으며, 트레이딩뷰에서 제공하거나 보증하는 것이 아닙니다. 자세한 내용은 이용 약관을 참조하세요.