OPEN-SOURCE SCRIPT
SMA+デマンド・オファーゾーン最強版(仮)
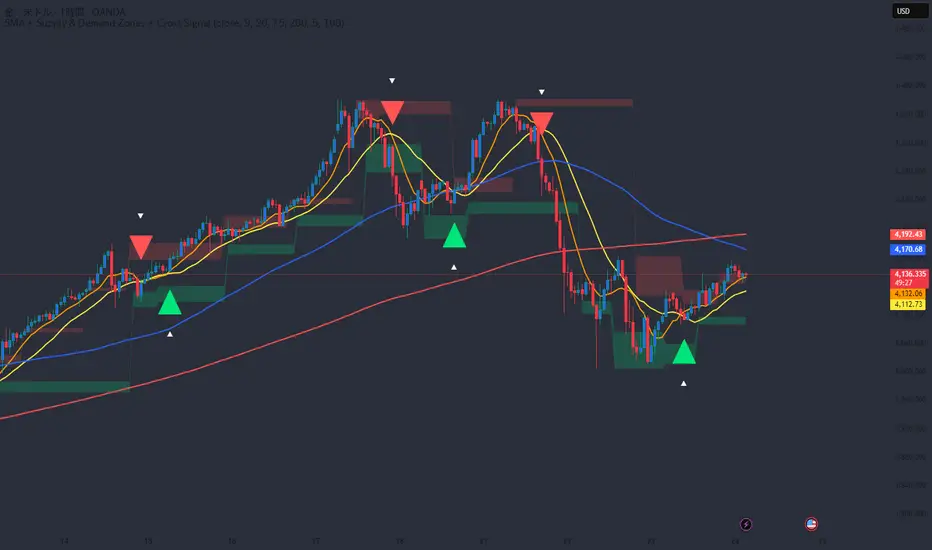
This indicator is designed to help traders visually identify both trend direction and potential reversal zones in one glance.
📊 Key Features:
• Displays 4 SMAs (9 / 20 / 75 / 200) simultaneously
• Automatically detects and plots Demand Zones (green) and Supply Zones (red) based on recent swing highs and lows
• Shows ▲ Golden Cross and ▼ Dead Cross markers when SMA 9 crosses SMA 20
• Built-in alert conditions for SMA crossovers and zone breakouts
💡 How to Use:
Use SMA direction and alignment to confirm the trend, and watch for Supply/Demand zones and cross signals as potential reversal or breakout setups.
Perfect for spotting pullbacks and identifying confluence zones between trend and structure.
⚙️ Customization:
• Adjustable SMA lengths, colors, and line widths
• Modify pivot length to fine-tune zone sensitivity
✅ Built with Pine Script v5
✅ Works on FX, Stocks, Crypto, and Indices
Author’s Note:
I created this indicator to combine trend-following tools with supply-demand logic in a clean and intuitive way.
Even beginners can easily visualize where reactions or breakouts are likely to happen.
If you find this script helpful, please give it a ❤️ and follow for more updates!
오픈 소스 스크립트
트레이딩뷰의 진정한 정신에 따라, 이 스크립트의 작성자는 이를 오픈소스로 공개하여 트레이더들이 기능을 검토하고 검증할 수 있도록 했습니다. 작성자에게 찬사를 보냅니다! 이 코드는 무료로 사용할 수 있지만, 코드를 재게시하는 경우 하우스 룰이 적용된다는 점을 기억하세요.
면책사항
해당 정보와 게시물은 금융, 투자, 트레이딩 또는 기타 유형의 조언이나 권장 사항으로 간주되지 않으며, 트레이딩뷰에서 제공하거나 보증하는 것이 아닙니다. 자세한 내용은 이용 약관을 참조하세요.
오픈 소스 스크립트
트레이딩뷰의 진정한 정신에 따라, 이 스크립트의 작성자는 이를 오픈소스로 공개하여 트레이더들이 기능을 검토하고 검증할 수 있도록 했습니다. 작성자에게 찬사를 보냅니다! 이 코드는 무료로 사용할 수 있지만, 코드를 재게시하는 경우 하우스 룰이 적용된다는 점을 기억하세요.
면책사항
해당 정보와 게시물은 금융, 투자, 트레이딩 또는 기타 유형의 조언이나 권장 사항으로 간주되지 않으며, 트레이딩뷰에서 제공하거나 보증하는 것이 아닙니다. 자세한 내용은 이용 약관을 참조하세요.