PROTECTED SOURCE SCRIPT
Earnings X-Ray and Fundamentals Data:VSMarketTrend
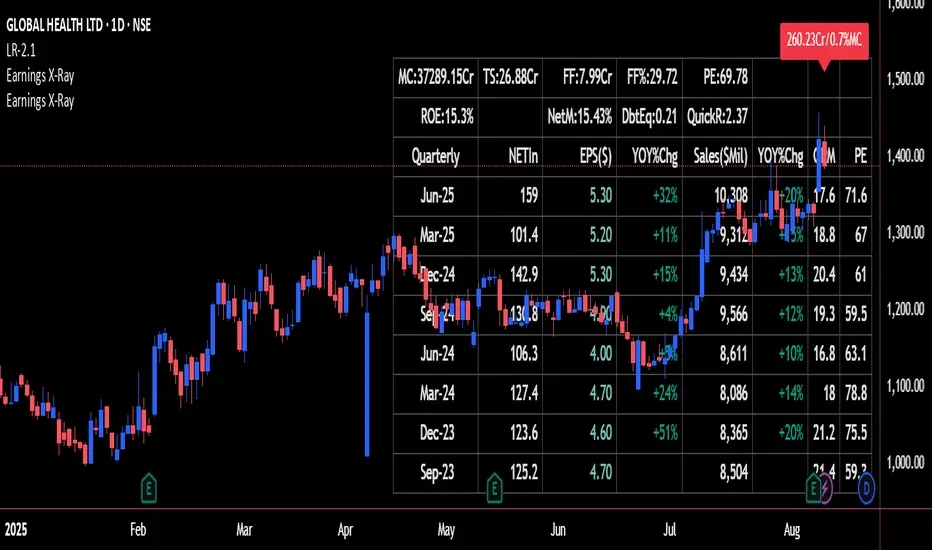
This indicator calculates essential financial metrics for stocks using TradingView's built-in functions and custom algorithms. The values are derived from fundamental data sources available on TradingView.
Key Output Metrics(YOY Basic Quaterly DATA)
MC (Market Cap): Company’s total market value (Price × Total Shares).
TS (Total Shares Outstanding): All shares (float + restricted) in circulation.
Sales: Annual revenue (TTM or latest fiscal year).
NETIn: Net income
P/E (Price-to-Earnings): Valuation ratio (Market Cap / Net Income or Price / EPS).
EPS (Earnings Per Share): Net income per share (Net Income / TS).
OPM (Operating Margin %): Core profitability (Operating Income / Revenue × 100).
Quick Ratio: Short-term liquidity ((Current Assets – Inventory) / Current Liabilities).
BVPS (Book Value Per Share): Equity per share (Shareholders’ Equity / TS).
PS (Price-to-Sales): Revenue-based valuation (Market Cap / Annual Revenue).
FCF (Free Cash Flow Per Share): Post-CapEx cash ((Operating Cash Flow – CapEx) / TS).
Data Sources & Methods
Uses TradingView’s request.financial() for income/balance sheet data (Revenue, EBITDA, etc.).
Fetches real-time metrics via request.security() (e.g., Shares Outstanding).
Normalizes data across timeframes (quarterly/annual).

Disclaimer
Not financial advice. Verify with official filings before trading.
Key Output Metrics(YOY Basic Quaterly DATA)
MC (Market Cap): Company’s total market value (Price × Total Shares).
TS (Total Shares Outstanding): All shares (float + restricted) in circulation.
Sales: Annual revenue (TTM or latest fiscal year).
NETIn: Net income
P/E (Price-to-Earnings): Valuation ratio (Market Cap / Net Income or Price / EPS).
EPS (Earnings Per Share): Net income per share (Net Income / TS).
OPM (Operating Margin %): Core profitability (Operating Income / Revenue × 100).
Quick Ratio: Short-term liquidity ((Current Assets – Inventory) / Current Liabilities).
BVPS (Book Value Per Share): Equity per share (Shareholders’ Equity / TS).
PS (Price-to-Sales): Revenue-based valuation (Market Cap / Annual Revenue).
FCF (Free Cash Flow Per Share): Post-CapEx cash ((Operating Cash Flow – CapEx) / TS).
Data Sources & Methods
Uses TradingView’s request.financial() for income/balance sheet data (Revenue, EBITDA, etc.).
Fetches real-time metrics via request.security() (e.g., Shares Outstanding).
Normalizes data across timeframes (quarterly/annual).
Disclaimer
Not financial advice. Verify with official filings before trading.
보호된 스크립트입니다
이 스크립트는 비공개 소스로 게시됩니다. 하지만 이를 자유롭게 제한 없이 사용할 수 있습니다 – 자세한 내용은 여기에서 확인하세요.
면책사항
해당 정보와 게시물은 금융, 투자, 트레이딩 또는 기타 유형의 조언이나 권장 사항으로 간주되지 않으며, 트레이딩뷰에서 제공하거나 보증하는 것이 아닙니다. 자세한 내용은 이용 약관을 참조하세요.
보호된 스크립트입니다
이 스크립트는 비공개 소스로 게시됩니다. 하지만 이를 자유롭게 제한 없이 사용할 수 있습니다 – 자세한 내용은 여기에서 확인하세요.
면책사항
해당 정보와 게시물은 금융, 투자, 트레이딩 또는 기타 유형의 조언이나 권장 사항으로 간주되지 않으며, 트레이딩뷰에서 제공하거나 보증하는 것이 아닙니다. 자세한 내용은 이용 약관을 참조하세요.