OPEN-SOURCE SCRIPT
Overbought & Oversold Tracker
About this indicator:
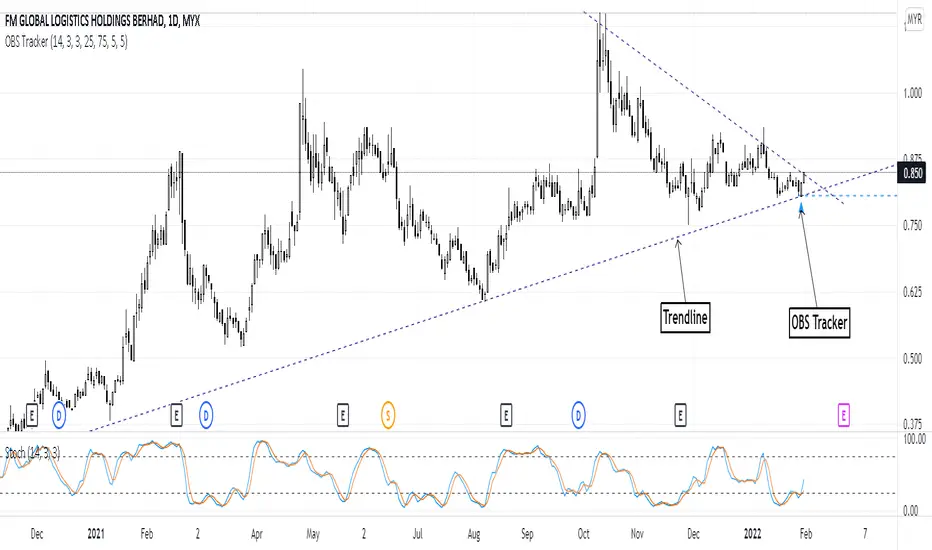
- This indicator is basically a stochastic indicator that shows to you the crossover in an Overbought or Oversold area DIRECTLY on the chart
How does it works:
- When Stochastic crosses at Oversold area, a Blue Triangle will appear below the candle with a Blue Dotted Line at the low of the current candle
- The Blue Triangle is to help you to see easily the candle where the crossover is occurring
- At the same time, the Blue Dotted Line will act as a minor Support for the current price
- If the current candle breaks the Blue Dotted Line (minor Support), the candle will be displayed in a red color
- Same things will occur if Stochastic crosses at the Overbought area, but at this time, a Red Triangle with Red Dotted Line will appear just to differentiate between Overbought and Oversold crossover
The advantage of using this indicator:
- You can easily see the point of stochastic crossover DIRECTLY on the chart without analyzing the stochastic indicator
- At the same time, it helps you to see clearly either the price is at the bottom / reversal by combining it with S&R / trendlines or other indicators
Personally, I will combine this indicator with:
a. Support and Resistance or Trendlines
b. Fibonacci retracement
c. Candlestick indicator (see my script list)
d. Ultimate MACD (see my script list)
e. Volume indicator
These combinations personally increase the possibility for me to buy exactly at the point of reversal in a pullback
- This indicator is preset at the value of 25 (oversold) and 75 (overbought) k line, it's my own preference. You can change these values at the setting menu to suit your trading style.
- Once again, I am opening the script for anyone to modify/alter it based on you own preference. Have a good day!
오픈 소스 스크립트
트레이딩뷰의 진정한 정신에 따라, 이 스크립트의 작성자는 이를 오픈소스로 공개하여 트레이더들이 기능을 검토하고 검증할 수 있도록 했습니다. 작성자에게 찬사를 보냅니다! 이 코드는 무료로 사용할 수 있지만, 코드를 재게시하는 경우 하우스 룰이 적용된다는 점을 기억하세요.
면책사항
해당 정보와 게시물은 금융, 투자, 트레이딩 또는 기타 유형의 조언이나 권장 사항으로 간주되지 않으며, 트레이딩뷰에서 제공하거나 보증하는 것이 아닙니다. 자세한 내용은 이용 약관을 참조하세요.
오픈 소스 스크립트
트레이딩뷰의 진정한 정신에 따라, 이 스크립트의 작성자는 이를 오픈소스로 공개하여 트레이더들이 기능을 검토하고 검증할 수 있도록 했습니다. 작성자에게 찬사를 보냅니다! 이 코드는 무료로 사용할 수 있지만, 코드를 재게시하는 경우 하우스 룰이 적용된다는 점을 기억하세요.
면책사항
해당 정보와 게시물은 금융, 투자, 트레이딩 또는 기타 유형의 조언이나 권장 사항으로 간주되지 않으며, 트레이딩뷰에서 제공하거나 보증하는 것이 아닙니다. 자세한 내용은 이용 약관을 참조하세요.