INVITE-ONLY SCRIPT
Alpha Trading - Pseudo Laplace Z Score
Alpha Trading - Pseudo Laplace Z Score
Slowly, very slowly a lot of quant and statistical methods have diffused the world of traditional technical analysis with the world of real math - VEPS (Volatility, Entropy, Probability and Statistics).
‘Alpha Trading' is showing the world how VEPS can show the best probabilities of success with your trading journey.
We send a big thank you to tradingview platform and pine coding team, for this great platform and the possibility to show the methods to trade with quant and statistical methods.
There appears to be resistance in the industry about these methods, so it is even more important now than ever, to support this awesome platform and amazing talented team at trading view and pine coders who enable us all with this wonderful platform to produce tools based on VEPS (Volatility, Entropy, Probability and Statistics).
The newest indicator from the Alpha Trading stable is the “Pseudo Laplace Z Score” which combines the established statistical method of z score applied on asset data. Which is based on our previous indicator called the “Alpha Trading – RMS-Z score”. We have made some optimizations, to give an even better fit to the specific returns of price. Optimizations are on the observation that returns are more Laplace distributed than Normal distributed.

figure 1: pink distribution of the real signal (BTC, 2D), gray is perfect theoretical Laplace distribution.
Therefore, the data is not Normal distributed, but Laplace distributed. Our new indicator calculates the real Z-Score of an underlying asset.
As Z Score is a standardized Normal distribution, it relies upon the definition of Normal distribution. If it deviates from this, it still can give useful information, but the absolute value (distance from the mean in standard deviations) is not reliable, and therefore the use of Normal distribution has some uncertainties.
Therefore, this indicator calculates a pseudo standard deviation, based on the Laplace distribution formulas and the relating Z Score.
By looking at the resulting distribution of the indicator itself, it is close to a perfect theoretical Normal distribution. It is much closer to the theoretical curve (gray), and thus indicates that the use of this approach is correct. Now we can show absolute values (i.e. distance to mean, in standard deviations) which can thus be considered to assist in determining the probabilities with your trading.

figure 2: distribution of indicator AT - Pseudo Laplace Z Score vs a theoretical perfect Normal distribution on BTC 4h
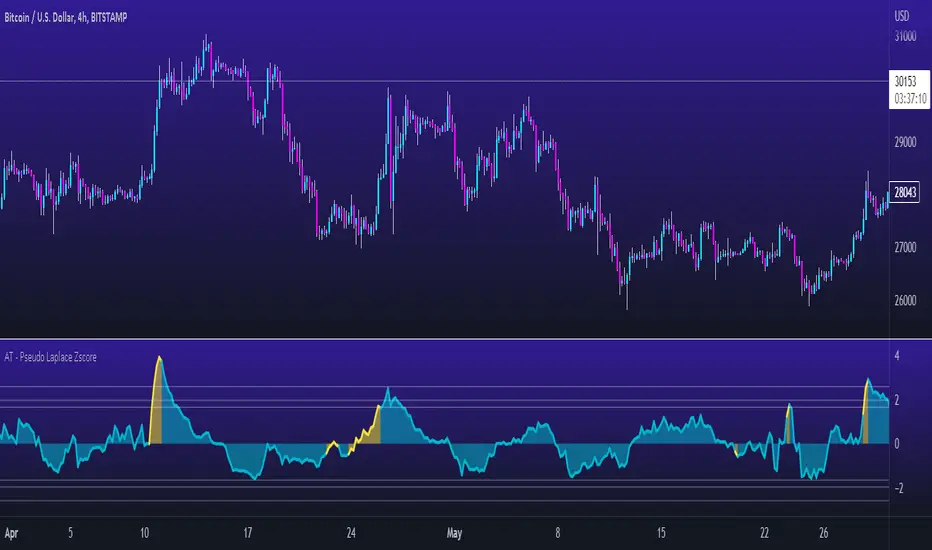
Looking at the indicator directly, it appears that the probability of 99% is crossed very rarely, like expected. Because only 1% of all candles we would expect this probability line to be exceeded.

figure 3: BTC 8h with AT-Pseudo Laplace Z Score
Coming back to the method of a Z Score in general. What is a Z-Score?
A Z-score is a numerical measurement that describes a value's relationship to the mean of a group of values. Z-score is measured in terms of standard deviations from the mean. If a Z-score is 0, it indicates that the data point's score is identical to the mean score. A Z-score of 1.0 would indicate a value that is one standard deviation from the mean. Z-scores may be positive or negative, with a positive value indicating the score is above the mean and a negative score indicating it is below the mean.
Simply put, a z-score (also called a standard score) gives you an idea of how far from the mean a data point is.
Basic guidelines How to Use this indicator:
Slowly, very slowly a lot of quant and statistical methods have diffused the world of traditional technical analysis with the world of real math - VEPS (Volatility, Entropy, Probability and Statistics).
‘Alpha Trading' is showing the world how VEPS can show the best probabilities of success with your trading journey.
We send a big thank you to tradingview platform and pine coding team, for this great platform and the possibility to show the methods to trade with quant and statistical methods.
There appears to be resistance in the industry about these methods, so it is even more important now than ever, to support this awesome platform and amazing talented team at trading view and pine coders who enable us all with this wonderful platform to produce tools based on VEPS (Volatility, Entropy, Probability and Statistics).
The newest indicator from the Alpha Trading stable is the “Pseudo Laplace Z Score” which combines the established statistical method of z score applied on asset data. Which is based on our previous indicator called the “Alpha Trading – RMS-Z score”. We have made some optimizations, to give an even better fit to the specific returns of price. Optimizations are on the observation that returns are more Laplace distributed than Normal distributed.
figure 1: pink distribution of the real signal (BTC, 2D), gray is perfect theoretical Laplace distribution.
Therefore, the data is not Normal distributed, but Laplace distributed. Our new indicator calculates the real Z-Score of an underlying asset.
As Z Score is a standardized Normal distribution, it relies upon the definition of Normal distribution. If it deviates from this, it still can give useful information, but the absolute value (distance from the mean in standard deviations) is not reliable, and therefore the use of Normal distribution has some uncertainties.
Therefore, this indicator calculates a pseudo standard deviation, based on the Laplace distribution formulas and the relating Z Score.
By looking at the resulting distribution of the indicator itself, it is close to a perfect theoretical Normal distribution. It is much closer to the theoretical curve (gray), and thus indicates that the use of this approach is correct. Now we can show absolute values (i.e. distance to mean, in standard deviations) which can thus be considered to assist in determining the probabilities with your trading.
figure 2: distribution of indicator AT - Pseudo Laplace Z Score vs a theoretical perfect Normal distribution on BTC 4h
Looking at the indicator directly, it appears that the probability of 99% is crossed very rarely, like expected. Because only 1% of all candles we would expect this probability line to be exceeded.
figure 3: BTC 8h with AT-Pseudo Laplace Z Score
Coming back to the method of a Z Score in general. What is a Z-Score?
A Z-score is a numerical measurement that describes a value's relationship to the mean of a group of values. Z-score is measured in terms of standard deviations from the mean. If a Z-score is 0, it indicates that the data point's score is identical to the mean score. A Z-score of 1.0 would indicate a value that is one standard deviation from the mean. Z-scores may be positive or negative, with a positive value indicating the score is above the mean and a negative score indicating it is below the mean.
Simply put, a z-score (also called a standard score) gives you an idea of how far from the mean a data point is.
Basic guidelines How to Use this indicator:
- Consider Entering a Long Position when the indicator is low. Best moves are generally when the indicator Turns yellow(outlier)
- Consider Entering a Short Position when the indicator is high. Best moves are generally when the indicator Turns yellow(outlier)
- Consider the 3 confidence interval lines (gray lines) at 90%, 95%, and 99%, as possible reversal point (with related probability that it is not getting exceeded 🡪 reversal)
초대 전용 스크립트
이 스크립트는 작성자가 승인한 사용자만 접근할 수 있습니다. 사용하려면 요청 후 승인을 받아야 하며, 일반적으로 결제 후에 허가가 부여됩니다. 자세한 내용은 아래 작성자의 안내를 따르거나 AlphaTrading-WolfPack에게 직접 문의하세요.
트레이딩뷰는 스크립트의 작동 방식을 충분히 이해하고 작성자를 완전히 신뢰하지 않는 이상, 해당 스크립트에 비용을 지불하거나 사용하는 것을 권장하지 않습니다. 커뮤니티 스크립트에서 무료 오픈소스 대안을 찾아보실 수도 있습니다.
작성자 지시 사항
If you have questions on how to set this indi up, please feel free to ask in the discord.
면책사항
해당 정보와 게시물은 금융, 투자, 트레이딩 또는 기타 유형의 조언이나 권장 사항으로 간주되지 않으며, 트레이딩뷰에서 제공하거나 보증하는 것이 아닙니다. 자세한 내용은 이용 약관을 참조하세요.