PROTECTED SOURCE SCRIPT
CAT Volume Accumulation
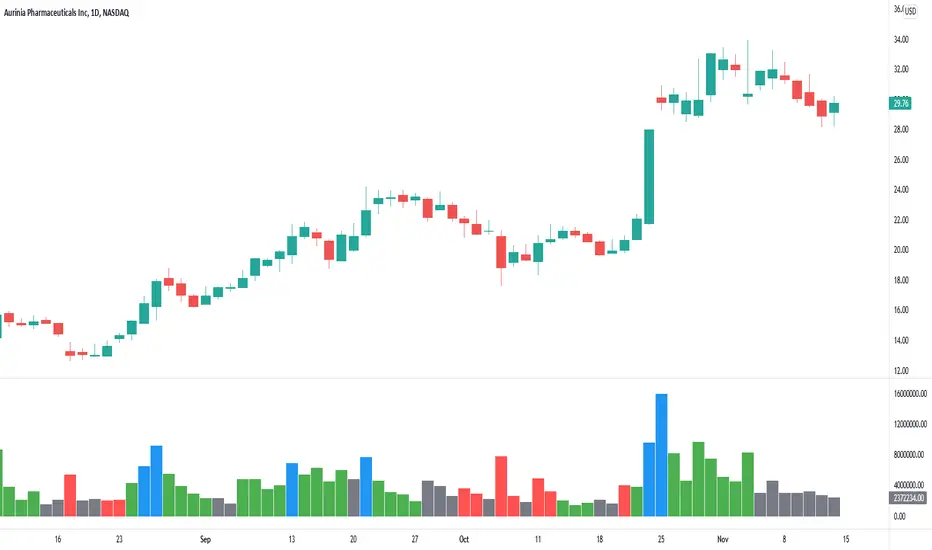
This indicator colors volume bars depending on change in price and volume. It helps traders to identify volume accumulation patterns.
The main interest for us is clusters of the blue bars and large green bars.
The blue volume bars are up days with unusually high trading volume .
Green bars are up days with normal trading volume .
Red bars are down days with elevated trading volume . It is not advisable to buy a stock on a day like that.
It makes sense to wait until a red down down is followed by a gray day, when price stop making lower low and trading volume dries down. That is a signal that bears lost momentum.
If we see a cluster of several blue bars that tells us there are institutional buyers building a position out there.
If we get a pullback that follows that volume accumulation pattern represented by several blue and large green bars that increases our chances for continuation of the move higher after a pullback.
보호된 스크립트입니다
이 스크립트는 비공개 소스로 게시됩니다. 하지만 이를 자유롭게 제한 없이 사용할 수 있습니다 – 자세한 내용은 여기에서 확인하세요.
Join my Telegram channel: t.me/TheCastAwayTrader
면책사항
해당 정보와 게시물은 금융, 투자, 트레이딩 또는 기타 유형의 조언이나 권장 사항으로 간주되지 않으며, 트레이딩뷰에서 제공하거나 보증하는 것이 아닙니다. 자세한 내용은 이용 약관을 참조하세요.
보호된 스크립트입니다
이 스크립트는 비공개 소스로 게시됩니다. 하지만 이를 자유롭게 제한 없이 사용할 수 있습니다 – 자세한 내용은 여기에서 확인하세요.
Join my Telegram channel: t.me/TheCastAwayTrader
면책사항
해당 정보와 게시물은 금융, 투자, 트레이딩 또는 기타 유형의 조언이나 권장 사항으로 간주되지 않으며, 트레이딩뷰에서 제공하거나 보증하는 것이 아닙니다. 자세한 내용은 이용 약관을 참조하세요.