INVITE-ONLY SCRIPT
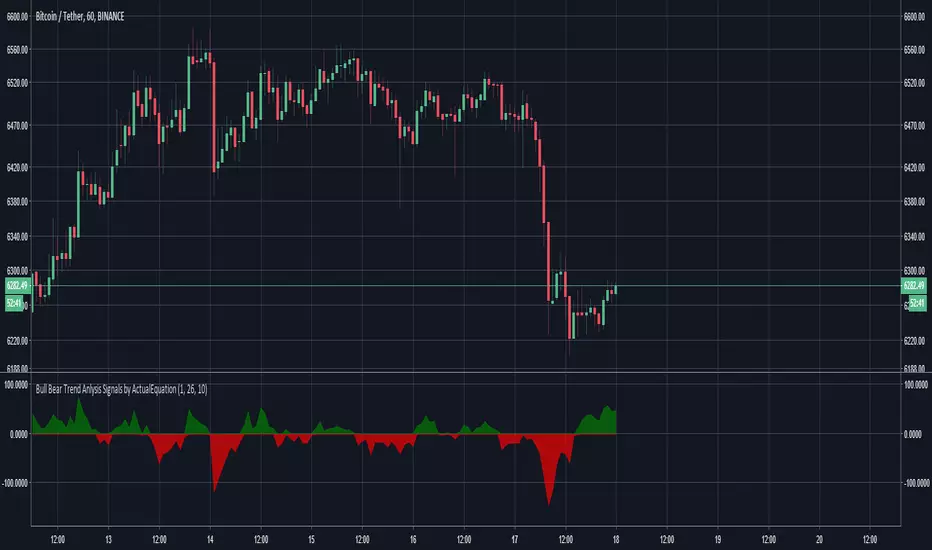
Bull Bear Trend Anlysis Signals by ActualEquation

This indicator analyzes the trend utilizing MACD and other math algorithms to find confirmed entries and exits.
How To Use
Best used on TF larger than 1 hour for highest accuracy.
The higher the wave the stronger the trend.
For entries, wait for the wave to rise then enter after a color flip.
Once flipped, you can look for entries at a smaller time frame to narrow down your buy price.
For shorts, wait for confirmation of color flip with initial red wave down.
BOUNCE PLAYS:
1. Find Divergences via the height of the wave.
2. The more stretched from 0 the stronger the strength.
3. If second drop/rise is less than first, then divergence is present, look for entry.
4. Zoom in to the hourly charts to find initial bounces, then zoom into 5 minutes to look for setups.
NOTE: all signals strength are based off the charts macro strength and most are delayed. If the signal is too high, then it should be the time to close position soon.
초대 전용 스크립트
이 스크립트는 작성자가 승인한 사용자만 접근할 수 있습니다. 사용하려면 요청 후 승인을 받아야 하며, 일반적으로 결제 후에 허가가 부여됩니다. 자세한 내용은 아래 작성자의 안내를 따르거나 ChaiQixuan에게 직접 문의하세요.
트레이딩뷰는 스크립트의 작동 방식을 충분히 이해하고 작성자를 완전히 신뢰하지 않는 이상, 해당 스크립트에 비용을 지불하거나 사용하는 것을 권장하지 않습니다. 커뮤니티 스크립트에서 무료 오픈소스 대안을 찾아보실 수도 있습니다.
작성자 지시 사항
면책사항
해당 정보와 게시물은 금융, 투자, 트레이딩 또는 기타 유형의 조언이나 권장 사항으로 간주되지 않으며, 트레이딩뷰에서 제공하거나 보증하는 것이 아닙니다. 자세한 내용은 이용 약관을 참조하세요.