OPEN-SOURCE SCRIPT
업데이트됨 BUY in HASH Ribbons
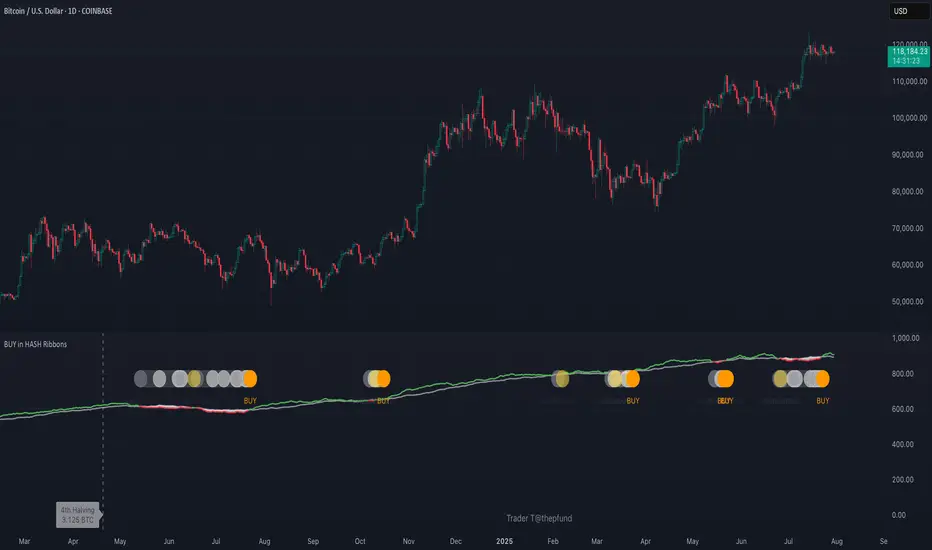
Hash Ribbons Indicator (BUY Signal)
A TradingView Pine Script v6 implementation for identifying Bitcoin miner capitulation (“Springs”) and recovery phases based on hash rate data. It marks potential low-risk buying opportunities by tracking short- and long-term moving averages of the network hash rate.
⸻
Key Features
• Hash Rate SMAs
• Short-term SMA (default: 30 days)
• Long-term SMA (default: 60 days)
• Phase Markers
• Gray circle: Short SMA crosses below long SMA (start of capitulation)
• White circles: Ongoing capitulation, with brighter white when the short SMA turns upward
• Yellow circle: Short SMA crosses back above long SMA (end of capitulation)
• Orange circle: Buy signal once hash rate recovery aligns with bullish price momentum (10-day price SMA crosses above 20-day price SMA)
• Display Modes
• Ribbons: Plots the two SMAs as colored bands—red for capitulation, green for recovery
• Oscillator: Shows the percentage difference between SMAs as a histogram (red for negative, blue for positive)
• Optional Overlays
• Bitcoin halving dates (2012, 2016, 2020, 2024) with dashed lines and labels
• Raw hash rate data in EH/s
• Alerts
• Configurable alerts for capitulation start, recovery, and buy signals
⸻
How It Works
1. Data Source: Fetches daily hash rate values from a selected provider (e.g., IntoTheBlock, Quandl).
2. Capitulation Detection: When the 30-day SMA falls below the 60-day SMA, miners are likely capitulating.
3. Recovery Identification: A rising 30-day SMA during capitulation signals miner recovery.
4. Buy Signal: Confirmed when the hash rate recovery coincides with a bullish shift in price momentum (10-day price SMA > 20-day price SMA).
⸻
Inputs
Hash Rate Short SMA: 30 days
Hash Rate Long SMA: 60 days
Plot Signals: On
Plot Halvings: Off
Plot Raw Hash Rate: Off
⸻
Considerations
• Timeframe: Best applied on daily charts to capture meaningful miner behavior.
• Data Reliability: Ensure the chosen hash rate source provides consistent, gap-free data.
• Risk Management: Use alongside other technical indicators (e.g., RSI, MACD) and fundamental analysis.
• Backtesting: Evaluate performance over different market cycles before live deployment.
릴리즈 노트
Code optimized;HR Source updated.
오픈 소스 스크립트
트레이딩뷰의 진정한 정신에 따라, 이 스크립트의 작성자는 이를 오픈소스로 공개하여 트레이더들이 기능을 검토하고 검증할 수 있도록 했습니다. 작성자에게 찬사를 보냅니다! 이 코드는 무료로 사용할 수 있지만, 코드를 재게시하는 경우 하우스 룰이 적용된다는 점을 기억하세요.
면책사항
해당 정보와 게시물은 금융, 투자, 트레이딩 또는 기타 유형의 조언이나 권장 사항으로 간주되지 않으며, 트레이딩뷰에서 제공하거나 보증하는 것이 아닙니다. 자세한 내용은 이용 약관을 참조하세요.
오픈 소스 스크립트
트레이딩뷰의 진정한 정신에 따라, 이 스크립트의 작성자는 이를 오픈소스로 공개하여 트레이더들이 기능을 검토하고 검증할 수 있도록 했습니다. 작성자에게 찬사를 보냅니다! 이 코드는 무료로 사용할 수 있지만, 코드를 재게시하는 경우 하우스 룰이 적용된다는 점을 기억하세요.
면책사항
해당 정보와 게시물은 금융, 투자, 트레이딩 또는 기타 유형의 조언이나 권장 사항으로 간주되지 않으며, 트레이딩뷰에서 제공하거나 보증하는 것이 아닙니다. 자세한 내용은 이용 약관을 참조하세요.