OPEN-SOURCE SCRIPT
업데이트됨 Earnings Expansion Projection

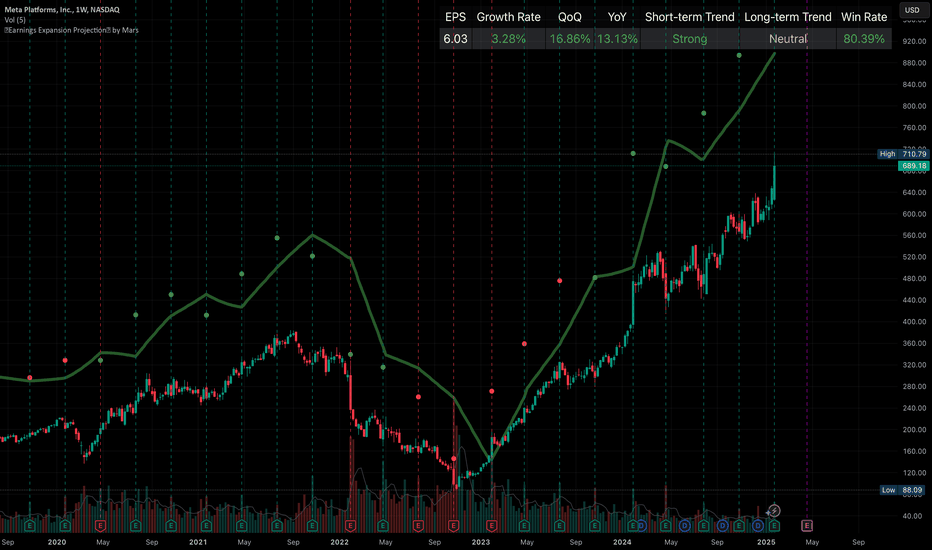
This indicator has no counterpart in the platform and is a professional-grade earnings visualization tool that plots EPS expansion directly on your charts, inspired by institutional-level technical analysis platforms.
The indicator creates a distinctive earnings expansion projection curve that can be a leading indicator of price direction moves.
Key features:
What is it doing?
It collects all earnings results available and will interpolate the numbers so that we see earnings expansion as a curve.
The video below describes usage
Note: Valid on the weekly time-frame only.
The indicator creates a distinctive earnings expansion projection curve that can be a leading indicator of price direction moves.
Key features:
- Clean, institutional-style, EPS-expansion projection line overlaid on price action
- Visual earnings surprise indicators with beat/miss multipliers
- Dashboard for rapid fundamental assessment including the stocks win rate on beatings / missing earnings historically and other fundamental information not readily available on Tradingview
What is it doing?
It collects all earnings results available and will interpolate the numbers so that we see earnings expansion as a curve.
The video below describes usage
Note: Valid on the weekly time-frame only.
릴리즈 노트
- smoother projections릴리즈 노트
This professional-grade indicator is unlike any other on TradingView. It brings an institutional-level approach to earnings analysis by transforming raw EPS data into a dynamic, forward-looking projection curve – a potential leading indicator of future price moves.What It Does:
Data Aggregation & Validation:
The tool collects every available earnings result—including both actual and standardized EPS—and rigorously validates the numbers. It filters out anomalies to ensure that only high-quality data contributes to the projection.
Dynamic Growth & Trend Analysis:
Using historical EPS, the indicator computes a dynamic growth rate. Choose between a straightforward comparison over recent quarters or a regression-based analysis over customizable lookback periods. In addition, it calculates both short-term and long-term trend averages to capture the momentum and evolving direction of earnings performance.
Smoothing & Scaling Techniques:
To reveal the underlying earnings expansion trend, the raw projection is smoothed via moving averages (with options for simple or exponential smoothing). This helps to reduce noise and provide a clean, easy-to-read curve. The projection is then scaled relative to the current price level—complete with adjustable multipliers and vertical shifts—so that it aligns visually with your chart.
Earnings Surprise Visualization:
Beyond the projection curve, the indicator highlights earnings surprises by plotting beat/miss multipliers. This immediate visual feedback shows how each earnings report deviates from expectations, offering further insight into the stock’s performance.
Integrated Fundamental Dashboard:
A built-in dashboard displays key metrics such as EPS value, growth rate, quarter-over-quarter (QoQ) and year-over-year (YoY) changes, short-term and long-term trend statuses, and even the historical win rate (beat vs. miss). This rapid-access data empowers you to quickly assess a company’s fundamental strength.
Key Features:
Institutional-Grade Analysis:
Leverages sophisticated statistical methods to interpolate and project earnings expansion, giving you a unique perspective on future EPS growth.
Adaptive Smoothing:
Filters out short-term fluctuations to highlight the true underlying trend of earnings expansion.
Visual Surprise Markers:
Instantly identify significant earnings beats or misses with clear, intuitive markers.
릴리즈 노트
Included a "recent win rate" for earnings beats using 8 previous quarters릴리즈 노트
trend assessments fixes오픈 소스 스크립트
트레이딩뷰의 진정한 정신에 따라, 이 스크립트의 작성자는 이를 오픈소스로 공개하여 트레이더들이 기능을 검토하고 검증할 수 있도록 했습니다. 작성자에게 찬사를 보냅니다! 이 코드는 무료로 사용할 수 있지만, 코드를 재게시하는 경우 하우스 룰이 적용된다는 점을 기억하세요.
Cyclist, Trader, Technologist. Get access to data for my options indicators on smartcanvas.com for free via bots
면책사항
해당 정보와 게시물은 금융, 투자, 트레이딩 또는 기타 유형의 조언이나 권장 사항으로 간주되지 않으며, 트레이딩뷰에서 제공하거나 보증하는 것이 아닙니다. 자세한 내용은 이용 약관을 참조하세요.
오픈 소스 스크립트
트레이딩뷰의 진정한 정신에 따라, 이 스크립트의 작성자는 이를 오픈소스로 공개하여 트레이더들이 기능을 검토하고 검증할 수 있도록 했습니다. 작성자에게 찬사를 보냅니다! 이 코드는 무료로 사용할 수 있지만, 코드를 재게시하는 경우 하우스 룰이 적용된다는 점을 기억하세요.
Cyclist, Trader, Technologist. Get access to data for my options indicators on smartcanvas.com for free via bots
면책사항
해당 정보와 게시물은 금융, 투자, 트레이딩 또는 기타 유형의 조언이나 권장 사항으로 간주되지 않으며, 트레이딩뷰에서 제공하거나 보증하는 것이 아닙니다. 자세한 내용은 이용 약관을 참조하세요.