PROTECTED SOURCE SCRIPT
업데이트됨 Ichimoku + Forecast + Signals
Ichimoku Kinko Hyo (IKH) (Japanese一目均衡表, Ichimoku Kinkō Hyō), usually shortened to "Ichimoku", is a technical analysis method that builds on candlestick charting to improve the accuracy of forecast price moves. - From Wikipedia, the free encyclopedia
This indicator is enhanced with the following helpful features:
Signals description:
This indicator is enhanced with the following helpful features:
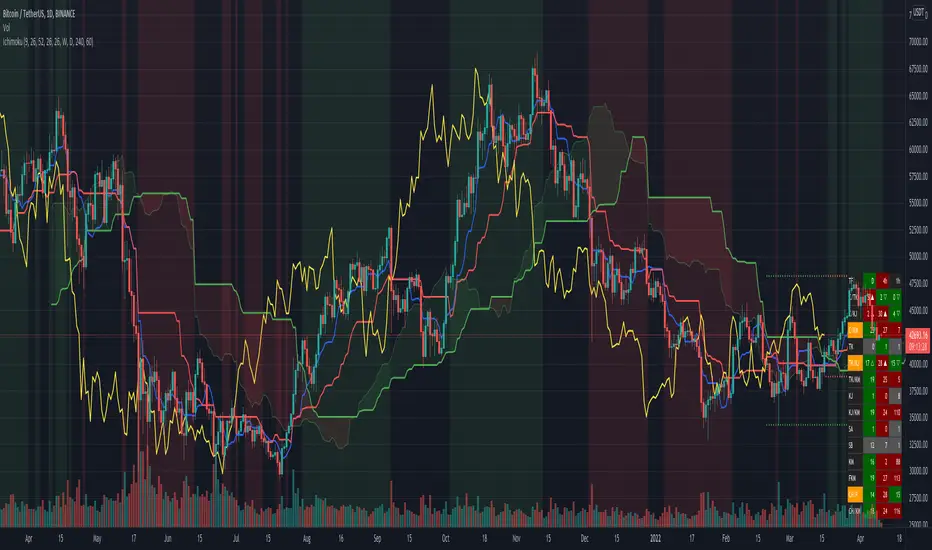
- Tenkan-sen, Kijun-sen, Senkou Span A and Senkou Span B 5 days forecast
- identified bullish (green color), bearish (red color), or flat/within (gray color) signals including the number of days it accrued from the last bar and the place of appearance (▲ - above bullish Kumo, △ - above bearish Kumo, ◆ - within bullish Kumo, ◇ - within bearish Kumo, ▼ - bellow bullish Kumo, ▽ - bellow bearish Kumo)
- lines indicating the range of the Tenkan-sen, Kijun-sen, and Senko Span B calculations (we can easily identify the highest-high and the lowest-low of the range and how long it will persist)
Signals description:
- C/TK - bullish/bearish Close/Tenkan-sen cross
- C/KJ - bullish/bearish Close/Kijun-sen cross
- C/KM - bullish/bearish/within Close/Kumo cross
- TK - bullish/bearish/flat Tenkan-sen
- TK/KJ - bullish/bearish Tenkan-sen/Kijun-sen cross
- TK/KM - bullish/bearish/within Tenkan-sen/Kumo cross
- KJ - bullish/bearish/flat Kijun-sen
- KJ/KM - bullish/bearish/within Kijun-sen/Kumo cross
- SA - bullish/bearish/flat Senkou Span A
- SB - bullish/bearish/flat Senkou Span B
- KM - bullish/bearish Kumo
- FKM - bullish/bearish future Kumo
- CH/P - bullish/bearish Chikou Span/Price cross
- CH/KM - bullish/bearish/within Chikou Span/Kumo cross
릴리즈 노트
- added Tenkan-sen, Kijun-sen, and Senko Span B range breakouts (indicated by ↗ if the price break out upper range and ↘ for breaking down the lower range)
- now you can select the signals which construct bullish (buy) or bearish (sell) condition. By default it is a price crossing Kumo, Tenkan crossing Kijun and Chikou breaking a price. For bullish condition, which will be coloured green on the chart, all signals must be bullish.
- added multi timeframe Ichimoku signals (max 4 timeframes + current one)
보호된 스크립트입니다
이 스크립트는 비공개 소스로 게시됩니다. 하지만 이를 자유롭게 제한 없이 사용할 수 있습니다 – 자세한 내용은 여기에서 확인하세요.
면책사항
해당 정보와 게시물은 금융, 투자, 트레이딩 또는 기타 유형의 조언이나 권장 사항으로 간주되지 않으며, 트레이딩뷰에서 제공하거나 보증하는 것이 아닙니다. 자세한 내용은 이용 약관을 참조하세요.
면책사항
해당 정보와 게시물은 금융, 투자, 트레이딩 또는 기타 유형의 조언이나 권장 사항으로 간주되지 않으며, 트레이딩뷰에서 제공하거나 보증하는 것이 아닙니다. 자세한 내용은 이용 약관을 참조하세요.