OPEN-SOURCE SCRIPT
업데이트됨 Running Minimum High
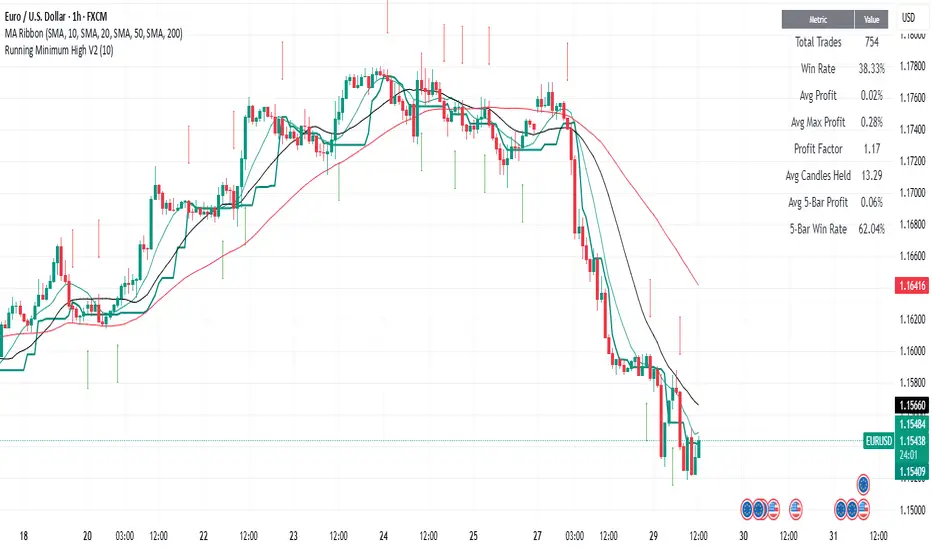
The running minimum high looks at the minimum high from a defined lookback period (default 10 days) and plots that on the price chart. Green arrows signify when the low of the candle is above the running minimum high (suggesting an uptrend), and red arrows signify when the high of the candle is below the running minimum high (suggesting a downtrend).
It is recommended to use this on high timeframes (e.g. 1 hour and above) given the high number of signals it generates on lower timeframes.
It is recommended to use this on high timeframes (e.g. 1 hour and above) given the high number of signals it generates on lower timeframes.
릴리즈 노트
The running minimum high looks at the minimum high from a defined lookback period (default 10 days) and plots that on the price chart. Green arrows signify when the low of the candle is above the running minimum high (suggesting an uptrend), and red arrows signify when the close of the candle is below the running minimum high (suggesting a downtrend).It is recommended to use this on high timeframes (e.g. 1 hour and above) given the high number of signals it generates on lower timeframes.
EDIT: Changed exit signal to when close is below minimum high.
릴리즈 노트
JULY 29TH UPDATE: Includes profit table, which shows overall profit calculations and profit after 5 bars with the option to show the profits in pips (EUR-USD style) for FOREX,오픈 소스 스크립트
트레이딩뷰의 진정한 정신에 따라, 이 스크립트의 작성자는 이를 오픈소스로 공개하여 트레이더들이 기능을 검토하고 검증할 수 있도록 했습니다. 작성자에게 찬사를 보냅니다! 이 코드는 무료로 사용할 수 있지만, 코드를 재게시하는 경우 하우스 룰이 적용된다는 점을 기억하세요.
면책사항
해당 정보와 게시물은 금융, 투자, 트레이딩 또는 기타 유형의 조언이나 권장 사항으로 간주되지 않으며, 트레이딩뷰에서 제공하거나 보증하는 것이 아닙니다. 자세한 내용은 이용 약관을 참조하세요.
오픈 소스 스크립트
트레이딩뷰의 진정한 정신에 따라, 이 스크립트의 작성자는 이를 오픈소스로 공개하여 트레이더들이 기능을 검토하고 검증할 수 있도록 했습니다. 작성자에게 찬사를 보냅니다! 이 코드는 무료로 사용할 수 있지만, 코드를 재게시하는 경우 하우스 룰이 적용된다는 점을 기억하세요.
면책사항
해당 정보와 게시물은 금융, 투자, 트레이딩 또는 기타 유형의 조언이나 권장 사항으로 간주되지 않으며, 트레이딩뷰에서 제공하거나 보증하는 것이 아닙니다. 자세한 내용은 이용 약관을 참조하세요.