OPEN-SOURCE SCRIPT
TradersFriendCandles v2
TradersFriendCandles
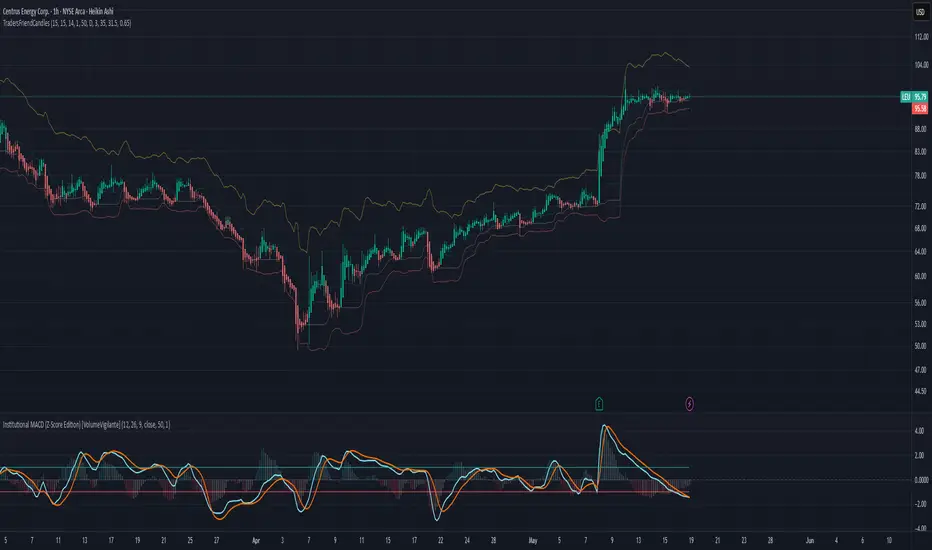
A fully customizable candle‑color and banding indicator built on percentile + ATR, with optional EMA vs. ALMA trend filtering and higher‑timeframe support.
Key Features
Dynamic Percentile Center Line
Compute any Nth percentile over M bars (default 20th over 15) to serve as a reference “mid‑price” level.
ATR‑Based Bands
Envelope that percentile line with upper/lower bands at X × ATR (default 1×), plus an extended upper band at 3.5× ATR.
Higher‑Timeframe Mode
Plot bands based on a higher timeframe (e.g. daily bands on a 15m chart) so you can gauge macro support/resistance in micro timeframes.
Custom‑Color Candles
5 user‑editable colors for:
- Strong bullish
- Light bullish
- Neutral
- Light bearish
- Strong bearish
Optional EMA vs. ALMA Trend Filter
When enabled, candles simply turn “bull” or “bear” based on fast EMA crossing above/below slow ALMA.
Border‑Only Coloring
Keep candle bodies transparent and color only the border & wick.
Live Plot Labels & Track Price
All lines carry titles and can display current values directly on the price scale.
Alerts
- Strong Bull Breakout (price stays above upper band)
- Strong Bear Breakdown (price closes below lower band)
- EMA/ALMA crossovers
Inputs & Customization
- Percentile level & lookback length
- ATR length, multiplier, opacity
- Fast EMA length, ALMA parameters (offset, length, sigma)
- Toggle bands, lines, custom candles, higher‑timeframe mode
- Pick your own colors via color‑picker inputs
Use TradersFriendCandles to visualize momentum shifts, dynamic support/resistance, and trend strength all in one overlay. Perfect for pinpointing breakouts, breakdowns, and filtering noise with adjustable sensitivity.
오픈 소스 스크립트
트레이딩뷰의 진정한 정신에 따라, 이 스크립트의 작성자는 이를 오픈소스로 공개하여 트레이더들이 기능을 검토하고 검증할 수 있도록 했습니다. 작성자에게 찬사를 보냅니다! 이 코드는 무료로 사용할 수 있지만, 코드를 재게시하는 경우 하우스 룰이 적용된다는 점을 기억하세요.
면책사항
해당 정보와 게시물은 금융, 투자, 트레이딩 또는 기타 유형의 조언이나 권장 사항으로 간주되지 않으며, 트레이딩뷰에서 제공하거나 보증하는 것이 아닙니다. 자세한 내용은 이용 약관을 참조하세요.
오픈 소스 스크립트
트레이딩뷰의 진정한 정신에 따라, 이 스크립트의 작성자는 이를 오픈소스로 공개하여 트레이더들이 기능을 검토하고 검증할 수 있도록 했습니다. 작성자에게 찬사를 보냅니다! 이 코드는 무료로 사용할 수 있지만, 코드를 재게시하는 경우 하우스 룰이 적용된다는 점을 기억하세요.
면책사항
해당 정보와 게시물은 금융, 투자, 트레이딩 또는 기타 유형의 조언이나 권장 사항으로 간주되지 않으며, 트레이딩뷰에서 제공하거나 보증하는 것이 아닙니다. 자세한 내용은 이용 약관을 참조하세요.