OPEN-SOURCE SCRIPT
Stochastic by BTBS
A little word before you are going to use it, this indicator is just a MODIFIED script.
The calculation part is NOT FROM ME, its still the original script by TradingView.
The Usage is still the same as you can take out of the info tab by TradingView.
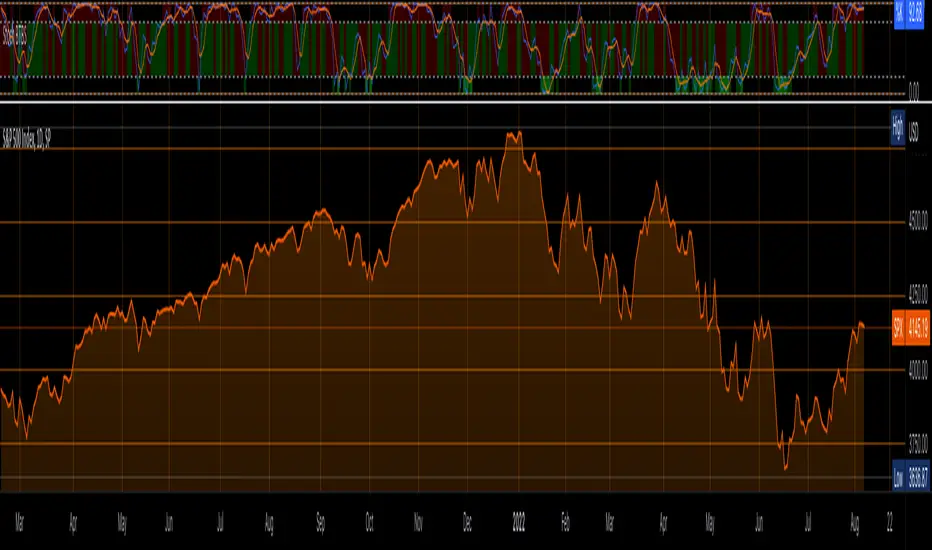
The only difference is that the Color Changes red when:
1. %K is over 80 (Upper Band-High Band)=(OVERBOUGHT)
2. %D lays over %K (%D>%K)
Changes green when:
1.%K is under 20 (Lower Band-Low Band)=(OVERSOLD)
%K lays over %D (%K>%D)
Tell me what I can add or do better :)
Tag me if you use this in a public Analysis :)
The calculation part is NOT FROM ME, its still the original script by TradingView.
The Usage is still the same as you can take out of the info tab by TradingView.
The only difference is that the Color Changes red when:
1. %K is over 80 (Upper Band-High Band)=(OVERBOUGHT)
2. %D lays over %K (%D>%K)
Changes green when:
1.%K is under 20 (Lower Band-Low Band)=(OVERSOLD)
%K lays over %D (%K>%D)
Tell me what I can add or do better :)
Tag me if you use this in a public Analysis :)
오픈 소스 스크립트
트레이딩뷰의 진정한 정신에 따라, 이 스크립트의 작성자는 이를 오픈소스로 공개하여 트레이더들이 기능을 검토하고 검증할 수 있도록 했습니다. 작성자에게 찬사를 보냅니다! 이 코드는 무료로 사용할 수 있지만, 코드를 재게시하는 경우 하우스 룰이 적용된다는 점을 기억하세요.
면책사항
해당 정보와 게시물은 금융, 투자, 트레이딩 또는 기타 유형의 조언이나 권장 사항으로 간주되지 않으며, 트레이딩뷰에서 제공하거나 보증하는 것이 아닙니다. 자세한 내용은 이용 약관을 참조하세요.
오픈 소스 스크립트
트레이딩뷰의 진정한 정신에 따라, 이 스크립트의 작성자는 이를 오픈소스로 공개하여 트레이더들이 기능을 검토하고 검증할 수 있도록 했습니다. 작성자에게 찬사를 보냅니다! 이 코드는 무료로 사용할 수 있지만, 코드를 재게시하는 경우 하우스 룰이 적용된다는 점을 기억하세요.
면책사항
해당 정보와 게시물은 금융, 투자, 트레이딩 또는 기타 유형의 조언이나 권장 사항으로 간주되지 않으며, 트레이딩뷰에서 제공하거나 보증하는 것이 아닙니다. 자세한 내용은 이용 약관을 참조하세요.