INVITE-ONLY SCRIPT
업데이트됨 EP Elephant Indicator
EP Elephant Indicator is the evolution of a previous indicator, EP MA Diff.
Longer averages were added, allowing to have a reference within the same timeframe of the short and long-term trend.
By adding the long socks, we also had the opportunity to discover new patterns, thus emerging the "Elephant" pattern, which finally gave the indicator its name.
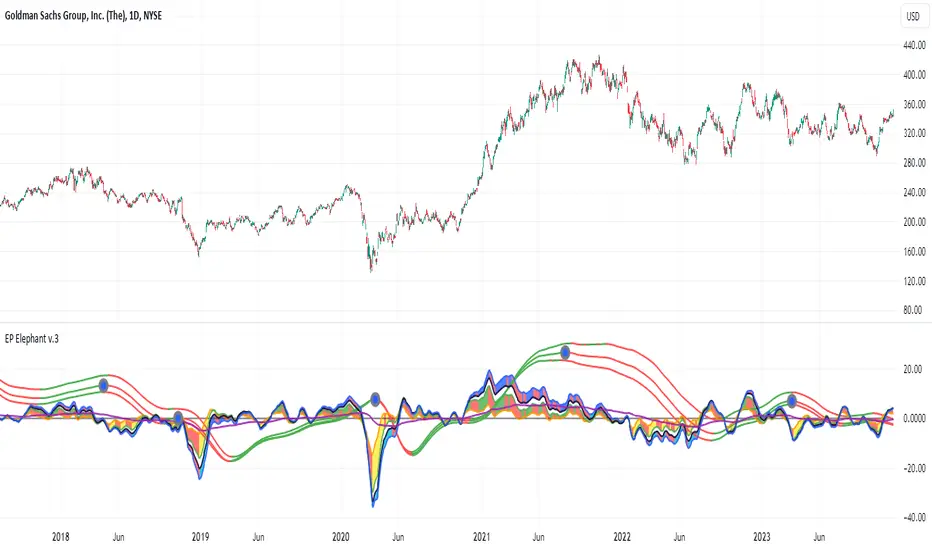
The elephant pattern is made up of three elements:
1.- Eye of the elephant. At first, we manually drew the eye. In newer versions of the indicator the eye is drawn automatically.
2.- Tusk of the elephant. It is drawn by the fastest averages, showing a short-term uptrend. In a lateral or bullish trend it can be a good time to buy.
3.- Trunk of the elephant. It always follows the elephant's eye and tusk, and is made up of the longest stockings.
The logic of this pattern is clear: We always look to buy after a price drop, either during an uptrend or at the end of a steep decline.
When an eye appears, we always expect the later appearance of the tusk. If we want further confirmation, we should wait for the averages 1-4 (in black) and 1-5 (blue) to rise. The lifting of the longest averages (of the trunk) indicates the change in trend.
This method helps us control our impulses, always anticipating the ideal moment of purchase. It gives very good results both when it comes to "catching the bottom" of a fall and when it comes to joining an uptrend already formed.
Optionally, we can make the indicator draw signals in the areas of interest, and color the bottom of the indicator in these areas.
These signals must always be taken with caution, evaluating the price action, and visually confirming the complete appearance of the patterns. These signals by no means show all the buying zones, and can sometimes give false entries.
We can confirm the operations with the signals given by other indicators, such as the EP Zenith and EP Change Index, and we recommend always to be aware of the trend lines, supports and resistances.
There are different types of "Elephants" that should be known to get the most out of the indicator.
Elephant Indicator is highly effective in volatile assets, and should take its signals with much more caution in very flat lateral trends.
The approach of all its averages can be taken as an early sign of a more abrupt movement, as it can happen for example with Bollinger Bands. On the contrary, long averages very far from the rest indicate a greater risk of correction.
Longer averages were added, allowing to have a reference within the same timeframe of the short and long-term trend.
By adding the long socks, we also had the opportunity to discover new patterns, thus emerging the "Elephant" pattern, which finally gave the indicator its name.
The elephant pattern is made up of three elements:
1.- Eye of the elephant. At first, we manually drew the eye. In newer versions of the indicator the eye is drawn automatically.
2.- Tusk of the elephant. It is drawn by the fastest averages, showing a short-term uptrend. In a lateral or bullish trend it can be a good time to buy.
3.- Trunk of the elephant. It always follows the elephant's eye and tusk, and is made up of the longest stockings.
The logic of this pattern is clear: We always look to buy after a price drop, either during an uptrend or at the end of a steep decline.
When an eye appears, we always expect the later appearance of the tusk. If we want further confirmation, we should wait for the averages 1-4 (in black) and 1-5 (blue) to rise. The lifting of the longest averages (of the trunk) indicates the change in trend.
This method helps us control our impulses, always anticipating the ideal moment of purchase. It gives very good results both when it comes to "catching the bottom" of a fall and when it comes to joining an uptrend already formed.
Optionally, we can make the indicator draw signals in the areas of interest, and color the bottom of the indicator in these areas.
These signals must always be taken with caution, evaluating the price action, and visually confirming the complete appearance of the patterns. These signals by no means show all the buying zones, and can sometimes give false entries.
We can confirm the operations with the signals given by other indicators, such as the EP Zenith and EP Change Index, and we recommend always to be aware of the trend lines, supports and resistances.
There are different types of "Elephants" that should be known to get the most out of the indicator.
Elephant Indicator is highly effective in volatile assets, and should take its signals with much more caution in very flat lateral trends.
The approach of all its averages can be taken as an early sign of a more abrupt movement, as it can happen for example with Bollinger Bands. On the contrary, long averages very far from the rest indicate a greater risk of correction.
릴리즈 노트
List of changes:- Added a smoothed Average LT, to better reflect the longer-term trend.
- Options have been added to hide or show the different types of indicator averages. All stockings have their reason for being, but if you like a cleaner design you have the option to do so.
For alerts in Tradingview, you can use "Alert Line", program your alerts for values above 0. In this way, TradingView will notify you of the Elephant alerts.
릴리즈 노트
EP ELEPHANT indicator is made up of several averages, which when moving form figures similar to elephant heads that appear one after another.It is made up of two pairs of averages, one fast and one slow, one long-lasting average and three very long-lasting averages.
The first pair of averages, the fast averages, follow the price movement more accurately.
The space between them is painted red when the averages are falling, and yellow or green when they are rising.
The second pair of averages, the slow ones, are based on averages of a slightly longer length.
The space between them is painted red when the averages are falling, and cyan or blue when they are rising.
The best entry opportunities usually occur in what we call the “tusk” of the elephant, in yellow: short ascending averages with the fastest average above the other.
Once an upward trend is established, we will see how the slow pair stands above the fast one. We will take advantage of the twists in the averages to join that trend.
EP ELEPHANT presents several typical patterns that can be used to take positions in the market. We list some of them:
TYPICAL ELEPHANT:
The elephant figure is shown complete:
Head, eye, descending trunk, tusk and ascending trunk.
REVERSAL CROSSING: Occurs after a sharp fall.
The averages cross the long one, fall and rise again, leaving a higher peak, and forming an easily recognizable pattern.
BULLISH ELEPHANT: After the appearance of a tusk, the averages are compressed, occupying a minimum space above the 0 line. The three longest averages end up coming out above all the others.
초대 전용 스크립트
이 스크립트는 작성자가 승인한 사용자만 접근할 수 있습니다. 사용하려면 요청 후 승인을 받아야 하며, 일반적으로 결제 후에 허가가 부여됩니다. 자세한 내용은 아래 작성자의 안내를 따르거나 EP-Trading에게 직접 문의하세요.
트레이딩뷰는 스크립트의 작동 방식을 충분히 이해하고 작성자를 완전히 신뢰하지 않는 이상, 해당 스크립트에 비용을 지불하거나 사용하는 것을 권장하지 않습니다. 커뮤니티 스크립트에서 무료 오픈소스 대안을 찾아보실 수도 있습니다.
작성자 지시 사항
Get your 30-day free trial by filling out the form at
https://epindicators.com/index.php/en/try-it-for-free
Check out our manuals and graph analysis on our website or on YouTube.
Subscribe at http://www.epindicators.com
면책사항
해당 정보와 게시물은 금융, 투자, 트레이딩 또는 기타 유형의 조언이나 권장 사항으로 간주되지 않으며, 트레이딩뷰에서 제공하거나 보증하는 것이 아닙니다. 자세한 내용은 이용 약관을 참조하세요.