OPEN-SOURCE SCRIPT
All Weekly Opens + Week Label
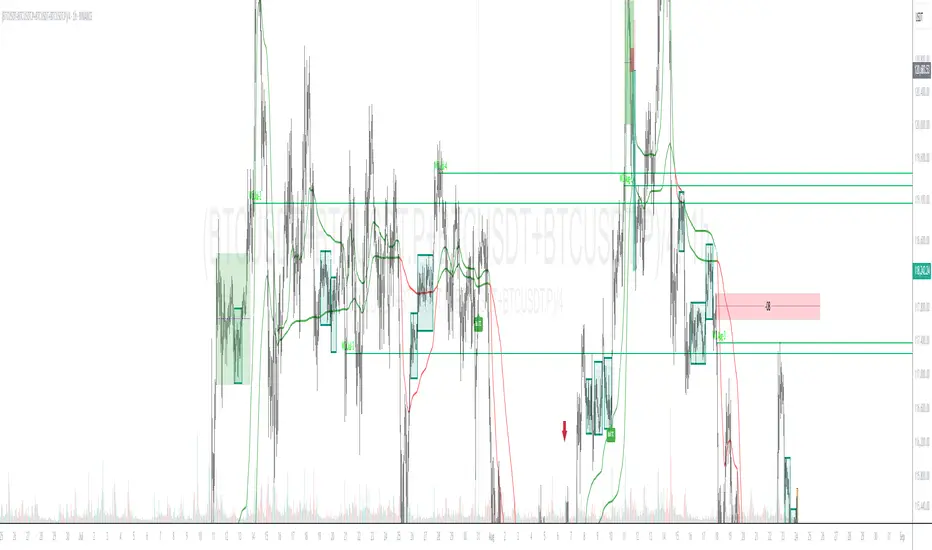
This script plots every Weekly Open (WO) across the entire chart, making it easy for traders to backtest how price reacts to weekly opens historically.
Each weekly open is drawn as a horizontal line and labeled with the month abbreviation and the week number of that month (e.g., WO Aug-4). This allows traders to quickly identify where each weekly session started and analyze market behavior around these key reference levels.
How it works
The script detects the first bar of each new week and records its opening price.
A horizontal line is drawn at that price, extending to the right.
An optional label shows the week name in the format Month-WeekNumber.
Traders can enable or disable labels, change line colors, line width, and optionally display the opening price in the label.
A new input allows filtering to show only the last N months of Weekly Opens. By default, all weekly opens are displayed, but traders can limit the chart to just the most recent ones for a cleaner view.
Why it’s useful
Weekly opens are often respected levels in both intraday and swing trading. They provide natural reference points for:
Backtesting market reactions to session opens.
Identifying areas of support/resistance around weekly levels.
Aligning trade entries and exits with higher-timeframe context.
Simplifying charts by focusing only on the most relevant recent weeks.
Notes
This indicator is not a trading signal generator.
It should be used as a contextual tool for analysis, helping traders improve risk management and entry precision.
Works on all symbols and timeframes.
The “last N months” filter is optional; setting it to 0 will plot all Weekly Opens available in the chart’s history.
오픈 소스 스크립트
트레이딩뷰의 진정한 정신에 따라, 이 스크립트의 작성자는 이를 오픈소스로 공개하여 트레이더들이 기능을 검토하고 검증할 수 있도록 했습니다. 작성자에게 찬사를 보냅니다! 이 코드는 무료로 사용할 수 있지만, 코드를 재게시하는 경우 하우스 룰이 적용된다는 점을 기억하세요.
면책사항
해당 정보와 게시물은 금융, 투자, 트레이딩 또는 기타 유형의 조언이나 권장 사항으로 간주되지 않으며, 트레이딩뷰에서 제공하거나 보증하는 것이 아닙니다. 자세한 내용은 이용 약관을 참조하세요.
오픈 소스 스크립트
트레이딩뷰의 진정한 정신에 따라, 이 스크립트의 작성자는 이를 오픈소스로 공개하여 트레이더들이 기능을 검토하고 검증할 수 있도록 했습니다. 작성자에게 찬사를 보냅니다! 이 코드는 무료로 사용할 수 있지만, 코드를 재게시하는 경우 하우스 룰이 적용된다는 점을 기억하세요.
면책사항
해당 정보와 게시물은 금융, 투자, 트레이딩 또는 기타 유형의 조언이나 권장 사항으로 간주되지 않으며, 트레이딩뷰에서 제공하거나 보증하는 것이 아닙니다. 자세한 내용은 이용 약관을 참조하세요.