PROTECTED SOURCE SCRIPT
Auto Trend Line (ATL) Indicator
Auto Trend Line (ATL) Indicator
Description:
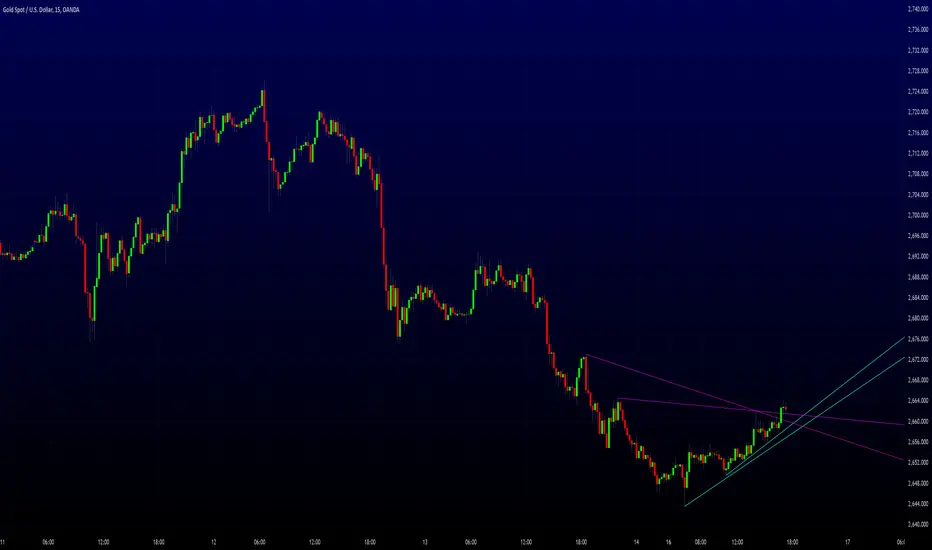
The Auto Trend Line indicator is an useful tool designed to automatically identify and draw key support and resistance levels on your chart. These levels are calculated based on historical price action, providing traders with a visual guide to potential market turning points. The indicator is highly customizable, allowing users to adjust parameters for history bars, factor values, and range values, ensuring adaptability to various trading strategies and timeframes.
Key Features:
• Automatic Support and Resistance Detection: Uses advanced algorithms to identify significant price levels.
• Customizable Line Styles and Colors: Personalize the appearance of support and resistance lines for clarity.
• Dynamic Updates: Adjusts lines in real-time based on price action.
• Extended Visibility: Draws lines that extend into the future, offering potential zones of interest for upcoming price movements.
Inputs:
• History Bars Count: Controls the range of historical data used in calculations.
• Factor and Range Values: Fine-tune the sensitivity of trend line detection.
• Line Styles and Colors: Choose between solid, dotted, or dashed lines for support and resistance, with customizable colors.
Use Case:
This indicator is ideal for traders who rely on support and resistance levels for decision-making in various markets, including stocks, forex, and cryptocurrencies. By automating the detection of these critical levels, the Auto Trend Line indicator saves time and eliminates subjective bias, empowering traders to focus on their strategies.
Explore the Auto Trend Line indicator to enhance your trading insights!
Developed by iSTAGs
Description:
The Auto Trend Line indicator is an useful tool designed to automatically identify and draw key support and resistance levels on your chart. These levels are calculated based on historical price action, providing traders with a visual guide to potential market turning points. The indicator is highly customizable, allowing users to adjust parameters for history bars, factor values, and range values, ensuring adaptability to various trading strategies and timeframes.
Key Features:
• Automatic Support and Resistance Detection: Uses advanced algorithms to identify significant price levels.
• Customizable Line Styles and Colors: Personalize the appearance of support and resistance lines for clarity.
• Dynamic Updates: Adjusts lines in real-time based on price action.
• Extended Visibility: Draws lines that extend into the future, offering potential zones of interest for upcoming price movements.
Inputs:
• History Bars Count: Controls the range of historical data used in calculations.
• Factor and Range Values: Fine-tune the sensitivity of trend line detection.
• Line Styles and Colors: Choose between solid, dotted, or dashed lines for support and resistance, with customizable colors.
Use Case:
This indicator is ideal for traders who rely on support and resistance levels for decision-making in various markets, including stocks, forex, and cryptocurrencies. By automating the detection of these critical levels, the Auto Trend Line indicator saves time and eliminates subjective bias, empowering traders to focus on their strategies.
Explore the Auto Trend Line indicator to enhance your trading insights!
Developed by iSTAGs
보호된 스크립트입니다
이 스크립트는 비공개 소스로 게시됩니다. 하지만 이를 자유롭게 제한 없이 사용할 수 있습니다 – 자세한 내용은 여기에서 확인하세요.
면책사항
해당 정보와 게시물은 금융, 투자, 트레이딩 또는 기타 유형의 조언이나 권장 사항으로 간주되지 않으며, 트레이딩뷰에서 제공하거나 보증하는 것이 아닙니다. 자세한 내용은 이용 약관을 참조하세요.
면책사항
해당 정보와 게시물은 금융, 투자, 트레이딩 또는 기타 유형의 조언이나 권장 사항으로 간주되지 않으며, 트레이딩뷰에서 제공하거나 보증하는 것이 아닙니다. 자세한 내용은 이용 약관을 참조하세요.