PROTECTED SOURCE SCRIPT
Whole Number Levels & Zones
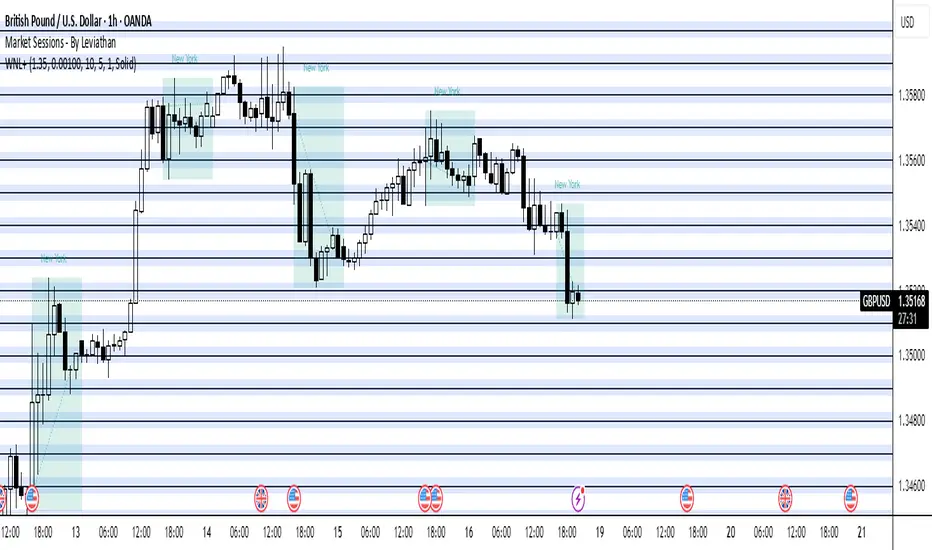
Whole Number Levels & Zones Indicator
This indicator is designed to automatically plot key psychological price levels on your chart. These are typically round numbers (e.g., 1.35000 on GBP/USD) where trading activity often clusters, creating potential support and resistance.
How It's Used:
Traders use these lines and zones to identify areas where the price might pause, reverse, or break out.
Support: If the price is falling, it may find support and bounce off one of these levels.
Resistance: If the price is rising, it may face resistance and stall at one of these levels.
Confirmation: It can be used alongside other indicators and analysis techniques to confirm trade entries or exits.
Key Features:
Automatic or Manual Levels: You can either let the indicator automatically adjust the lines based on the current price or anchor them to a specific starting price you choose.
Customizable Intervals: You can set the distance between each line (e.g., every 50 or 100 pips).
Shaded Zones: You can enable a shaded box around each line to better visualize the price zones. The height of this box is adjustable.
Full Styling Control: You have complete control over the color, style (dashed, solid, dotted), and thickness of the lines and zones to match your chart's theme.
보호된 스크립트입니다
이 스크립트는 비공개 소스로 게시됩니다. 하지만 이를 자유롭게 제한 없이 사용할 수 있습니다 – 자세한 내용은 여기에서 확인하세요.
면책사항
해당 정보와 게시물은 금융, 투자, 트레이딩 또는 기타 유형의 조언이나 권장 사항으로 간주되지 않으며, 트레이딩뷰에서 제공하거나 보증하는 것이 아닙니다. 자세한 내용은 이용 약관을 참조하세요.
면책사항
해당 정보와 게시물은 금융, 투자, 트레이딩 또는 기타 유형의 조언이나 권장 사항으로 간주되지 않으며, 트레이딩뷰에서 제공하거나 보증하는 것이 아닙니다. 자세한 내용은 이용 약관을 참조하세요.