INVITE-ONLY SCRIPT
업데이트됨 Accumulation Manipulation PO3 and MMXM
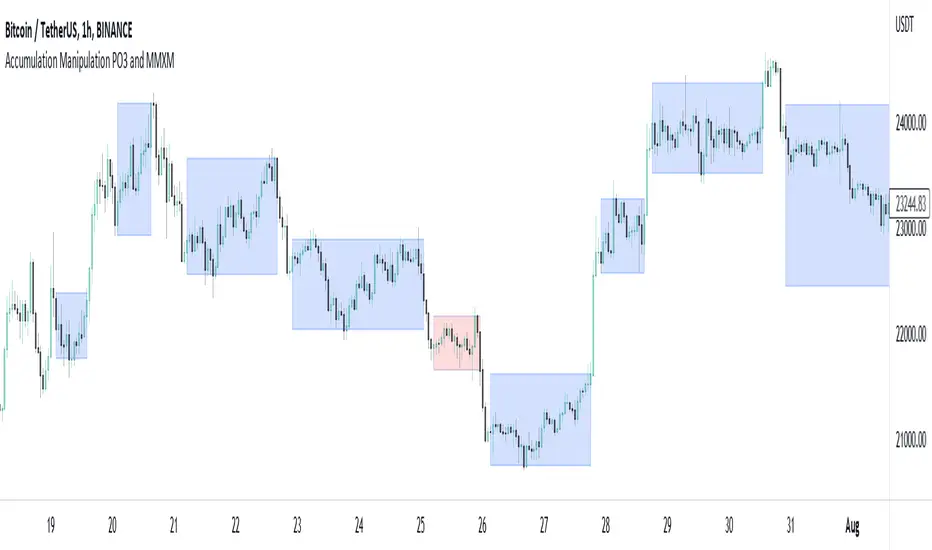
Much is said about the market maker or manipulation of price, but there aren't many indicators that try to show this, until now.
Using an easily customisable, but intelligent algorithm, this indicator tries to find and highlight when price is 'ranging', or 'accumulating'. It does this by looking at changes in price and quantifying the strength of the change, based on current and historical changes, and can therfore decide if price is staying in range or breaking out. By showing this on the chart several approaches can be taken.
Simply, you can trade within the range, and also trade breakouts of the range, knowing that price will react at these range 'levels'.
Alternatively, you can use the accumulation boxes to try and identify MMXM models, that is Market Maker Buy and Market Maker Sell Models, where price moves in phases of consolidation, smart money reversal and re-accumulation.
Finally, using the manipulation detection option, you can try to identify when a sudden change in price is actually manipulation by institutions, and plan to trade the distribution phase accordingly. This accumulation, manipulation, distribution is also known as Power of 3, PO3.
This indicator does not try to teach any of these ideas, only help to visualise them on the chart, and as such should not be considered financial advice.
릴리즈 노트
Changed default for 'Show Manipulation' setting to True / On.초대 전용 스크립트
이 스크립트는 작성자가 승인한 사용자만 접근할 수 있습니다. 사용하려면 요청 후 승인을 받아야 하며, 일반적으로 결제 후에 허가가 부여됩니다. 자세한 내용은 아래 작성자의 안내를 따르거나 Texmoonbeam에게 직접 문의하세요.
트레이딩뷰는 스크립트의 작동 방식을 충분히 이해하고 작성자를 완전히 신뢰하지 않는 이상, 해당 스크립트에 비용을 지불하거나 사용하는 것을 권장하지 않습니다. 커뮤니티 스크립트에서 무료 오픈소스 대안을 찾아보실 수도 있습니다.
작성자 지시 사항
Please direct message me on TradingView or Twitter if you would like to try out this indicator or for queries and requests.
Contact me directly on TradingView or Twitter for queries, for purchasing and indicator guides please check here texmoonbeam.notion.site/TradingView-Indicators-by-Texmoonbeam-9f09de3020864ff6a786004af3ba2488
면책사항
해당 정보와 게시물은 금융, 투자, 트레이딩 또는 기타 유형의 조언이나 권장 사항으로 간주되지 않으며, 트레이딩뷰에서 제공하거나 보증하는 것이 아닙니다. 자세한 내용은 이용 약관을 참조하세요.
초대 전용 스크립트
이 스크립트는 작성자가 승인한 사용자만 접근할 수 있습니다. 사용하려면 요청 후 승인을 받아야 하며, 일반적으로 결제 후에 허가가 부여됩니다. 자세한 내용은 아래 작성자의 안내를 따르거나 Texmoonbeam에게 직접 문의하세요.
트레이딩뷰는 스크립트의 작동 방식을 충분히 이해하고 작성자를 완전히 신뢰하지 않는 이상, 해당 스크립트에 비용을 지불하거나 사용하는 것을 권장하지 않습니다. 커뮤니티 스크립트에서 무료 오픈소스 대안을 찾아보실 수도 있습니다.
작성자 지시 사항
Please direct message me on TradingView or Twitter if you would like to try out this indicator or for queries and requests.
Contact me directly on TradingView or Twitter for queries, for purchasing and indicator guides please check here texmoonbeam.notion.site/TradingView-Indicators-by-Texmoonbeam-9f09de3020864ff6a786004af3ba2488
면책사항
해당 정보와 게시물은 금융, 투자, 트레이딩 또는 기타 유형의 조언이나 권장 사항으로 간주되지 않으며, 트레이딩뷰에서 제공하거나 보증하는 것이 아닙니다. 자세한 내용은 이용 약관을 참조하세요.