INVITE-ONLY SCRIPT
HADES Timecycle SMT
What this indicator tracks
1) Time‑cycles based on QT (Micro → 90‑minute → Daily → Weekly)
HADESSMT segments the trading day and week into recurring phases and paints them directly on your chart:
real time plotting of SSMTs for Micro cycles, when Q1 and Q2 highs or lows are different for correlated assets. same for the 90‑minute quarters , Daily cycles and Weekly cycles
2) SSMT : The script continuously compares your chart to a correlated instrument and highlights cycle‑scoped SMT divergences :
Scopes: Micro, 90m, Daily, Weekly.
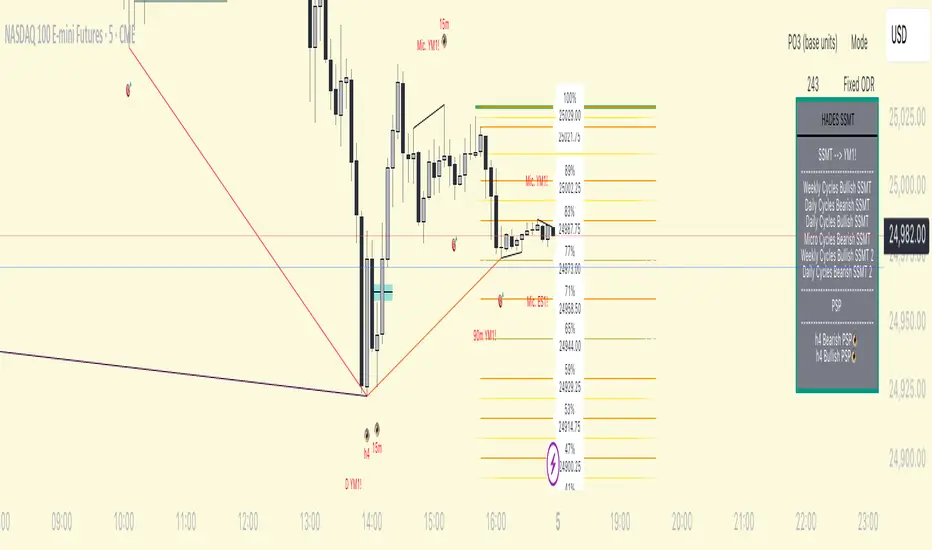
The tool draws compact slanted segments between consecutive cycle highs/lows and places a small label with the scope tag (e.g., 90m, D, W, Mic.) and the comparison ticker.
Table summary: A docked panel logs Bullish/Bearish SMT currently active per scope.
In plain English: when two tightly related markets fail to confirm each other’s new extremes inside the same cycle window, HADESSMT calls that out visually and in the table.
3) PSP /scanner (👁️)
A compact scanner runs on 240m, 60m, and 15m composite views of your chosen inter‑market set and tags bars with an eye icon (👁️):
👁️ below price → a bullish turning‑point signature.
👁️ above price → a bearish turning‑point signature.
Events are logged in the table (e.g., “60m Bullish PSP 👁️”).
Treat PSP tags as context—they’re not trade signals by themselves. They often add confluence when they align with SSMT and cycle boundaries.
4) “True Open” levels
includes a daily open line that marks midnight open for the day.
Inter‑market sets (Triads & Dyads)
HADESSMT automatically picks a comparison instrument based on what you’re charting. Two mechanisms exist:
Triads (auto‑pairing):
FX: EUR + GBP ↔ inverse DXY
Metals: Gold + Silver
US Indices: NQ + YM + ES
You can show one or both comparison legs.
Tip: If you don’t see SMT labels, ensure your symbol belongs to one of the configured sets or customize the tickers in Triad inputs.
On‑chart visuals you’ll see
Thin slanted SMT markers between successive cycle extremes with a small scope/ticker tag.
👁️ PSP labels on higher‑timeframe bars.
True‑Open lines labeled 00:00 (daily) .
Summary table (right side by default) containing:
The comparison ticker currently in use,
Any active Bullish/Bearish SMT per scope,
Recent PSP 👁️ calls at 240/60/15 minutes.
How to use it (practical flow)
Pick your market & ensure a comparison exists (Triad ).
Important: HADESSMT is a context engine, not a trade system. Use your own risk management and confirmation.
Triad– enable one/both SMT comparisons; edit the default tickers if your broker symbols differ.
Timezone – UTC offset (default -4) to align cycle splits with your session.
Micro features appear on charts ≤ 5m.
90‑minute features are designed for charts ≤ 30m.
Daily features prefer charts ≤ 3h.
Weekly features render reliably on daily charts and below.
(If a layer doesn’t appear, you may be on a timeframe above its designed threshold.)
FAQs
Why don’t I see SMT on my market?
Ensure the symbol is in one of the configured Triad sets, or add your own correlated ticker(s).
What exactly is PSP?
A compact pressure/turn signature across your inter‑market set. It’s presented as an 👁️ tag and a table entry (bullish/bearish). The internal detection specifics are intentionally abstracted.
1) Time‑cycles based on QT (Micro → 90‑minute → Daily → Weekly)
HADESSMT segments the trading day and week into recurring phases and paints them directly on your chart:
real time plotting of SSMTs for Micro cycles, when Q1 and Q2 highs or lows are different for correlated assets. same for the 90‑minute quarters , Daily cycles and Weekly cycles
2) SSMT : The script continuously compares your chart to a correlated instrument and highlights cycle‑scoped SMT divergences :
Scopes: Micro, 90m, Daily, Weekly.
The tool draws compact slanted segments between consecutive cycle highs/lows and places a small label with the scope tag (e.g., 90m, D, W, Mic.) and the comparison ticker.
Table summary: A docked panel logs Bullish/Bearish SMT currently active per scope.
In plain English: when two tightly related markets fail to confirm each other’s new extremes inside the same cycle window, HADESSMT calls that out visually and in the table.
3) PSP /scanner (👁️)
A compact scanner runs on 240m, 60m, and 15m composite views of your chosen inter‑market set and tags bars with an eye icon (👁️):
👁️ below price → a bullish turning‑point signature.
👁️ above price → a bearish turning‑point signature.
Events are logged in the table (e.g., “60m Bullish PSP 👁️”).
Treat PSP tags as context—they’re not trade signals by themselves. They often add confluence when they align with SSMT and cycle boundaries.
4) “True Open” levels
includes a daily open line that marks midnight open for the day.
Inter‑market sets (Triads & Dyads)
HADESSMT automatically picks a comparison instrument based on what you’re charting. Two mechanisms exist:
Triads (auto‑pairing):
FX: EUR + GBP ↔ inverse DXY
Metals: Gold + Silver
US Indices: NQ + YM + ES
You can show one or both comparison legs.
Tip: If you don’t see SMT labels, ensure your symbol belongs to one of the configured sets or customize the tickers in Triad inputs.
On‑chart visuals you’ll see
Thin slanted SMT markers between successive cycle extremes with a small scope/ticker tag.
👁️ PSP labels on higher‑timeframe bars.
True‑Open lines labeled 00:00 (daily) .
Summary table (right side by default) containing:
The comparison ticker currently in use,
Any active Bullish/Bearish SMT per scope,
Recent PSP 👁️ calls at 240/60/15 minutes.
How to use it (practical flow)
Pick your market & ensure a comparison exists (Triad ).
Important: HADESSMT is a context engine, not a trade system. Use your own risk management and confirmation.
Triad– enable one/both SMT comparisons; edit the default tickers if your broker symbols differ.
Timezone – UTC offset (default -4) to align cycle splits with your session.
Micro features appear on charts ≤ 5m.
90‑minute features are designed for charts ≤ 30m.
Daily features prefer charts ≤ 3h.
Weekly features render reliably on daily charts and below.
(If a layer doesn’t appear, you may be on a timeframe above its designed threshold.)
FAQs
Why don’t I see SMT on my market?
Ensure the symbol is in one of the configured Triad sets, or add your own correlated ticker(s).
What exactly is PSP?
A compact pressure/turn signature across your inter‑market set. It’s presented as an 👁️ tag and a table entry (bullish/bearish). The internal detection specifics are intentionally abstracted.
초대 전용 스크립트
이 스크립트는 작성자가 승인한 사용자만 접근할 수 있습니다. 사용하려면 요청 후 승인을 받아야 하며, 일반적으로 결제 후에 허가가 부여됩니다. 자세한 내용은 아래 작성자의 안내를 따르거나 HadesFutures에게 직접 문의하세요.
트레이딩뷰는 스크립트의 작동 방식을 충분히 이해하고 작성자를 완전히 신뢰하지 않는 이상, 해당 스크립트에 비용을 지불하거나 사용하는 것을 권장하지 않습니다. 커뮤니티 스크립트에서 무료 오픈소스 대안을 찾아보실 수도 있습니다.
작성자 지시 사항
Donate to get access
Price action trader- At the correct time i inverse your gap
면책사항
해당 정보와 게시물은 금융, 투자, 트레이딩 또는 기타 유형의 조언이나 권장 사항으로 간주되지 않으며, 트레이딩뷰에서 제공하거나 보증하는 것이 아닙니다. 자세한 내용은 이용 약관을 참조하세요.