OPEN-SOURCE SCRIPT
업데이트됨 Signal Moving Average [LuxAlgo]
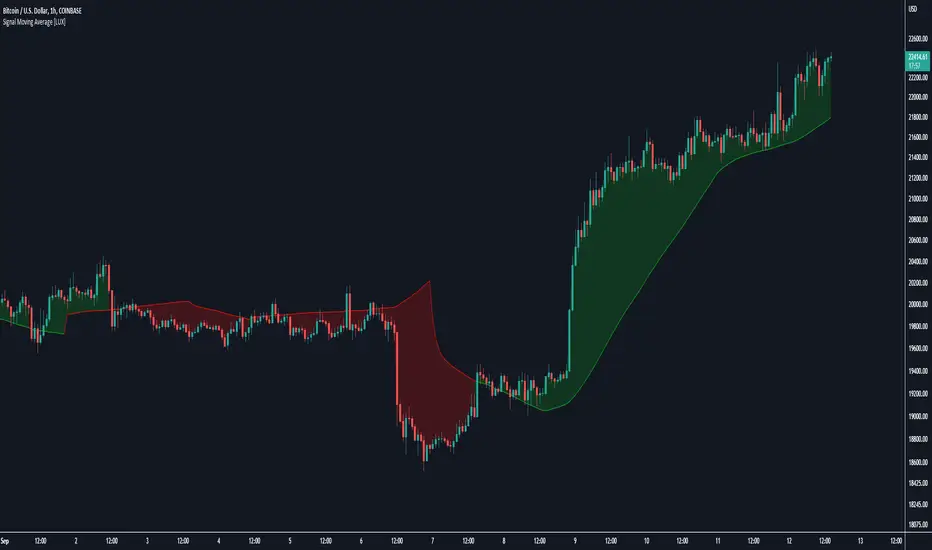
The following script returns a moving average designed to be used as a signal line in a moving average crossover system. The moving average will diverge from the price during ranging markets and reach the value of a regular moving average during trending markets.
Settings
Usage
Moving average crossover strategies often rely on a "signal" line, a slower moving average used to determine a general trend. This signal line is paired with a faster moving average to filter out potential whipsaw trades that would have been given from crosses between the regular price and the signal line.

The proposed indicator will avoid crossing the price by diverging from it during more ranging periods, thus effectively reducing the number of crosses produced between the price and the signal line.

The color of the area between the price and the signal line is determined by the position of the price relative to the signal line, with a green color indicator a price superior to the signal line.
The color of the signal line, however, is taking into account whether market is trending or ranging, only changing once the market is trending.

The chart above shows the cumulated number of crosses between the price and the signal line (green) and a regular simple moving average of the same period (red) on AMD 15m, a lowered number of crosses can effectively reduce the impact of frictional costs introduced by whipsaw trades.
Settings
- Length: Moving average period
- Src: Source input of the indicator
Usage
Moving average crossover strategies often rely on a "signal" line, a slower moving average used to determine a general trend. This signal line is paired with a faster moving average to filter out potential whipsaw trades that would have been given from crosses between the regular price and the signal line.
The proposed indicator will avoid crossing the price by diverging from it during more ranging periods, thus effectively reducing the number of crosses produced between the price and the signal line.
The color of the area between the price and the signal line is determined by the position of the price relative to the signal line, with a green color indicator a price superior to the signal line.
The color of the signal line, however, is taking into account whether market is trending or ranging, only changing once the market is trending.
The chart above shows the cumulated number of crosses between the price and the signal line (green) and a regular simple moving average of the same period (red) on AMD 15m, a lowered number of crosses can effectively reduce the impact of frictional costs introduced by whipsaw trades.
릴리즈 노트
Updated chart릴리즈 노트
Minor changes릴리즈 노트
Minor changes.오픈 소스 스크립트
트레이딩뷰의 진정한 정신에 따라, 이 스크립트의 작성자는 이를 오픈소스로 공개하여 트레이더들이 기능을 검토하고 검증할 수 있도록 했습니다. 작성자에게 찬사를 보냅니다! 이 코드는 무료로 사용할 수 있지만, 코드를 재게시하는 경우 하우스 룰이 적용된다는 점을 기억하세요.
Get exclusive indicators & AI trading strategies: luxalgo.com
Free 150k+ community: discord.gg/lux
All content provided by LuxAlgo is for informational & educational purposes only. Past performance does not guarantee future results.
Free 150k+ community: discord.gg/lux
All content provided by LuxAlgo is for informational & educational purposes only. Past performance does not guarantee future results.
면책사항
해당 정보와 게시물은 금융, 투자, 트레이딩 또는 기타 유형의 조언이나 권장 사항으로 간주되지 않으며, 트레이딩뷰에서 제공하거나 보증하는 것이 아닙니다. 자세한 내용은 이용 약관을 참조하세요.
오픈 소스 스크립트
트레이딩뷰의 진정한 정신에 따라, 이 스크립트의 작성자는 이를 오픈소스로 공개하여 트레이더들이 기능을 검토하고 검증할 수 있도록 했습니다. 작성자에게 찬사를 보냅니다! 이 코드는 무료로 사용할 수 있지만, 코드를 재게시하는 경우 하우스 룰이 적용된다는 점을 기억하세요.
Get exclusive indicators & AI trading strategies: luxalgo.com
Free 150k+ community: discord.gg/lux
All content provided by LuxAlgo is for informational & educational purposes only. Past performance does not guarantee future results.
Free 150k+ community: discord.gg/lux
All content provided by LuxAlgo is for informational & educational purposes only. Past performance does not guarantee future results.
면책사항
해당 정보와 게시물은 금융, 투자, 트레이딩 또는 기타 유형의 조언이나 권장 사항으로 간주되지 않으며, 트레이딩뷰에서 제공하거나 보증하는 것이 아닙니다. 자세한 내용은 이용 약관을 참조하세요.