OPEN-SOURCE SCRIPT
Buying/Selling Proxy
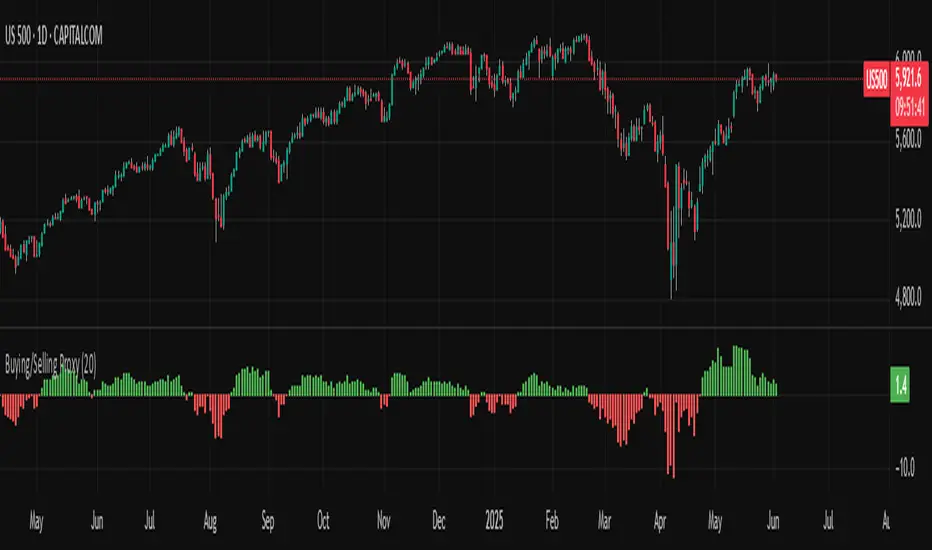
TiltFolio Buying/Selling Proxy
This simple but effective indicator visualizes short-term buying or selling pressure using log returns over a rolling window.
How It Works:
Plotted as a color-coded histogram:
✅ Green = net buying
❌ Red = net selling
Why Use It:
This proxy helps traders gauge directional bias and momentum beneath the surface of price action — especially useful for confirming breakout strength, timing entries, or filtering signals.
- Inspired by academic return normalization, but optimized for practical use.
- Use alongside TiltFolio's Breakout Trend indicator for added context.
This simple but effective indicator visualizes short-term buying or selling pressure using log returns over a rolling window.
How It Works:
- Calculates the average of logarithmic returns over the past N bars (default: 20).
- Positive values suggest sustained buying pressure; negative values indicate selling pressure.
Plotted as a color-coded histogram:
✅ Green = net buying
❌ Red = net selling
Why Use It:
This proxy helps traders gauge directional bias and momentum beneath the surface of price action — especially useful for confirming breakout strength, timing entries, or filtering signals.
- Inspired by academic return normalization, but optimized for practical use.
- Use alongside TiltFolio's Breakout Trend indicator for added context.
오픈 소스 스크립트
트레이딩뷰의 진정한 정신에 따라, 이 스크립트의 작성자는 이를 오픈소스로 공개하여 트레이더들이 기능을 검토하고 검증할 수 있도록 했습니다. 작성자에게 찬사를 보냅니다! 이 코드는 무료로 사용할 수 있지만, 코드를 재게시하는 경우 하우스 룰이 적용된다는 점을 기억하세요.
면책사항
해당 정보와 게시물은 금융, 투자, 트레이딩 또는 기타 유형의 조언이나 권장 사항으로 간주되지 않으며, 트레이딩뷰에서 제공하거나 보증하는 것이 아닙니다. 자세한 내용은 이용 약관을 참조하세요.
오픈 소스 스크립트
트레이딩뷰의 진정한 정신에 따라, 이 스크립트의 작성자는 이를 오픈소스로 공개하여 트레이더들이 기능을 검토하고 검증할 수 있도록 했습니다. 작성자에게 찬사를 보냅니다! 이 코드는 무료로 사용할 수 있지만, 코드를 재게시하는 경우 하우스 룰이 적용된다는 점을 기억하세요.
면책사항
해당 정보와 게시물은 금융, 투자, 트레이딩 또는 기타 유형의 조언이나 권장 사항으로 간주되지 않으며, 트레이딩뷰에서 제공하거나 보증하는 것이 아닙니다. 자세한 내용은 이용 약관을 참조하세요.