OPEN-SOURCE SCRIPT
Option Buying Pivot and SMA 3 Pivot crossover
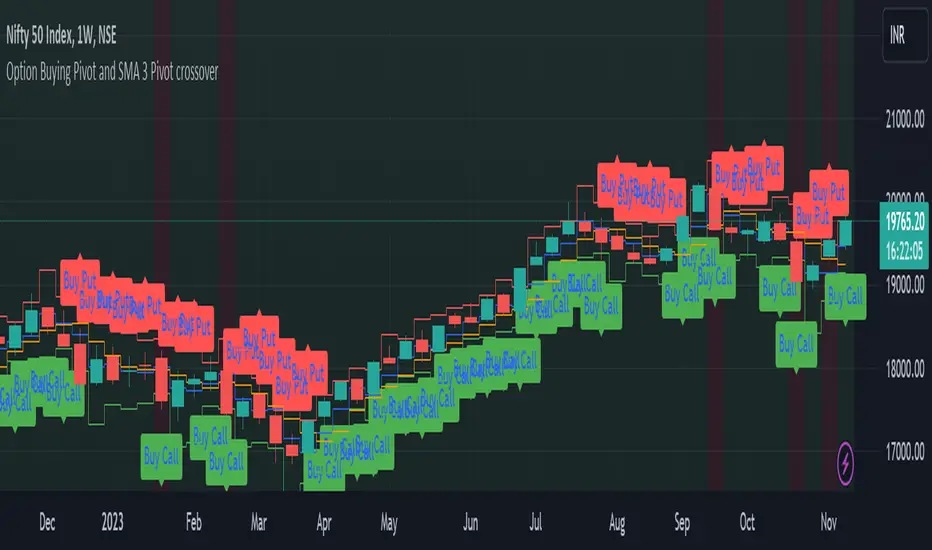
This script is designed as a visual aid for options trading specifically for option buying, providing information about potential entry points, Option levels, and trade outcomes. Here's a summary of the key elements:
1. Pivot Point and True Range:*
- The script calculates the current candle's pivot point, representing an average of high, low, and close prices from the previous candle.
- True range, a measure of volatility, is determined using the high, low, and close prices of the last two candles.
2. Option Levels:
- Downside (PutValue - Red colour line) and upside (CallValue - Green Colour line) are calculated based on the current pivot point and true range.
PutValue = currentCandlePivot + currentCandleTrueRange
CallValue = currentCandlePivot - currentCandleTrueRange
3. Simple Moving Average (SMA) of Pivot Point:
- A 3-period SMA is applied to the pivot point to smooth out fluctuations.
4. Trade Entry Logic:
- Long entry is signalled when the current pivot point is above the SMA. (longEntry = currentCandlePivot > smaPivot)
- At the time of long entry BUY THE CALL OPTION OR SELL THE PUT OPTION near the CallValue Green line
- Short entry is signalled when the current pivot point is below the SMA. (shortEntry = currentCandlePivot < smaPivot)
- At the time of Short entry BUY THE PUT OPTION OR SELL THE CALL OPTION near the PutValue Red line
The indicator having option to change the background of the candle as a green for long; and change the background of the candle as red for short. Also, Having the option to plot as label.
5. Win and Loss Logic:
- Winning conditions are assessed based on the close price relative to CallValue (for Long) and PutValue (for Short).
- Losing conditions are determined similarly.
- winLong = close > CallValue and longEntry
- winShort = close < PutValue and shortEntry
-lossLong = close < CallValue and longEntry
-lossShort = close > PutValue and shortEntry
The indicator having option to change the background of the candle as a green for win; and change the background of the candle as red for loss. Also, Having the option to plot as label.
6. Background Coloring and Plots:
- The script uses background colors to highlight Long, Short, Win, and Loss scenarios.
- Shapes and labels are plotted on the chart to visually represent entry points, stop-loss levels, and trade outcomes.
The overall purpose is to provide traders with a clear visual representation of potential trading opportunities and outcomes, helping them make informed decisions in the options market.
오픈 소스 스크립트
트레이딩뷰의 진정한 정신에 따라, 이 스크립트의 작성자는 이를 오픈소스로 공개하여 트레이더들이 기능을 검토하고 검증할 수 있도록 했습니다. 작성자에게 찬사를 보냅니다! 이 코드는 무료로 사용할 수 있지만, 코드를 재게시하는 경우 하우스 룰이 적용된다는 점을 기억하세요.
면책사항
해당 정보와 게시물은 금융, 투자, 트레이딩 또는 기타 유형의 조언이나 권장 사항으로 간주되지 않으며, 트레이딩뷰에서 제공하거나 보증하는 것이 아닙니다. 자세한 내용은 이용 약관을 참조하세요.
오픈 소스 스크립트
트레이딩뷰의 진정한 정신에 따라, 이 스크립트의 작성자는 이를 오픈소스로 공개하여 트레이더들이 기능을 검토하고 검증할 수 있도록 했습니다. 작성자에게 찬사를 보냅니다! 이 코드는 무료로 사용할 수 있지만, 코드를 재게시하는 경우 하우스 룰이 적용된다는 점을 기억하세요.
면책사항
해당 정보와 게시물은 금융, 투자, 트레이딩 또는 기타 유형의 조언이나 권장 사항으로 간주되지 않으며, 트레이딩뷰에서 제공하거나 보증하는 것이 아닙니다. 자세한 내용은 이용 약관을 참조하세요.