OPEN-SOURCE SCRIPT
Pookies SL/TP Lines
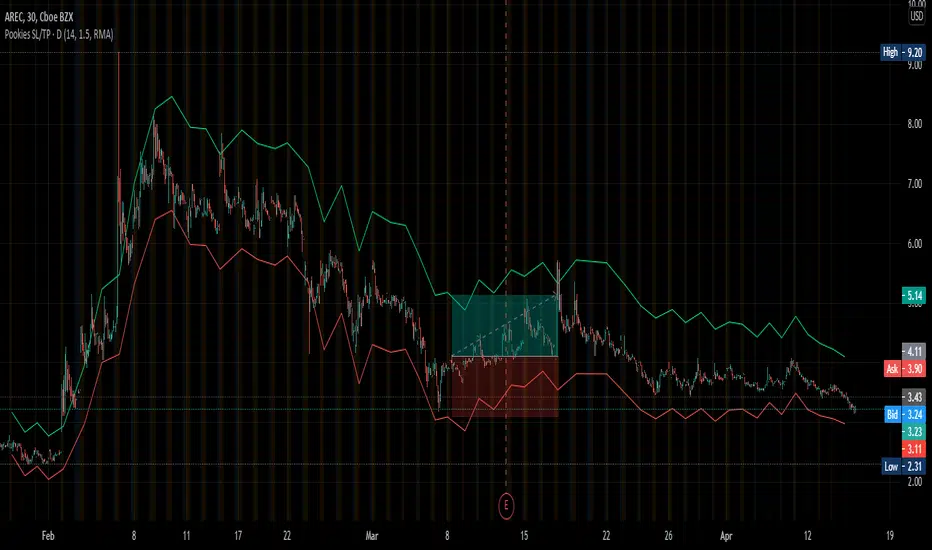
This indicator calculates Stop-loss and Take-profit limits and plots them on the chart based on the daily ATR value for a given instrument.
The Stop-loss is calculated at the current close price minus 1x ATR and is plotted as a red line by default.
The Take-profit is calculated at the current close price plus 1.5x ATR and is plotted as a green line by default.
The colors for each line can be changed, as well as the default ATR values (length, smoothing).
To use:
When you see a long or short signal (your own preference), enter your position and set your take-profit and stop-loss limits at the current red/green lines, based on whatever Risk-Reward you've set it to.
This is also helpful in determining whether or not a trade offers enough potential to risk prior to entering the trade.
When the lines are far apart, the ATR is high. When the lines are close together, the ATR is low. This can be used to determine volatility and allow traders to buy during consolidation and sell into strength.
Thank you.
오픈 소스 스크립트
트레이딩뷰의 진정한 정신에 따라, 이 스크립트의 작성자는 이를 오픈소스로 공개하여 트레이더들이 기능을 검토하고 검증할 수 있도록 했습니다. 작성자에게 찬사를 보냅니다! 이 코드는 무료로 사용할 수 있지만, 코드를 재게시하는 경우 하우스 룰이 적용된다는 점을 기억하세요.
면책사항
해당 정보와 게시물은 금융, 투자, 트레이딩 또는 기타 유형의 조언이나 권장 사항으로 간주되지 않으며, 트레이딩뷰에서 제공하거나 보증하는 것이 아닙니다. 자세한 내용은 이용 약관을 참조하세요.
오픈 소스 스크립트
트레이딩뷰의 진정한 정신에 따라, 이 스크립트의 작성자는 이를 오픈소스로 공개하여 트레이더들이 기능을 검토하고 검증할 수 있도록 했습니다. 작성자에게 찬사를 보냅니다! 이 코드는 무료로 사용할 수 있지만, 코드를 재게시하는 경우 하우스 룰이 적용된다는 점을 기억하세요.
면책사항
해당 정보와 게시물은 금융, 투자, 트레이딩 또는 기타 유형의 조언이나 권장 사항으로 간주되지 않으며, 트레이딩뷰에서 제공하거나 보증하는 것이 아닙니다. 자세한 내용은 이용 약관을 참조하세요.