PROTECTED SOURCE SCRIPT
DSI - Dynamic Strength Index
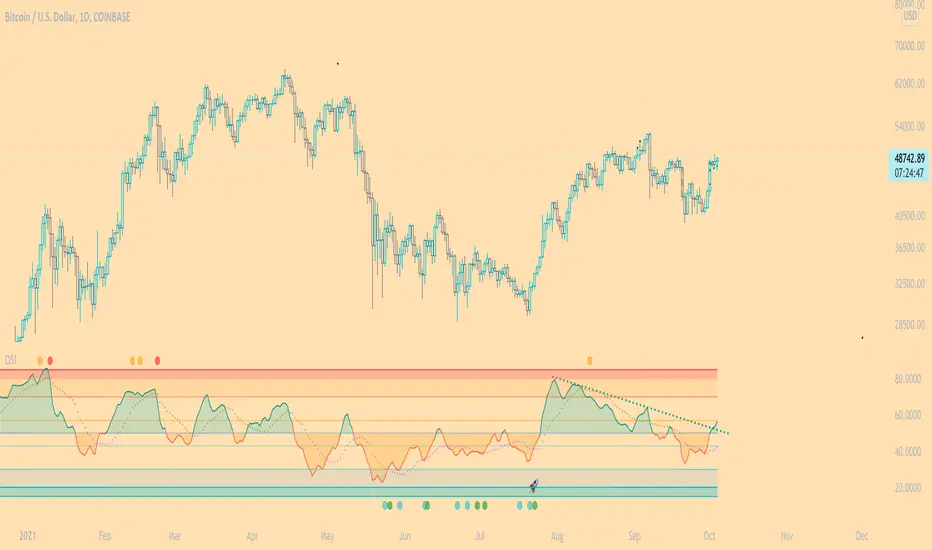
The DSI is a volume weighted momentum indicator similar but superior to the traditional RSI.
The DSI algorithm takes values for RSI, MFI, OBV and stochastics, then gives them each a different weighting depending on their historic reliability in different market conditions, and then averages out the values.
This results in a very reliable, noise-free momentum indicator, especially reliable on high timeframes.
Further features include:
Auto Trendlines - Up-downtrend lines to show support, resistance and breakouts
Supertrend- A momentum (ATR based) version of the Supertrend.
Divergences - Bullish and bearish momentum divergences, with confirmation signals.
General Rules:
Bullish above 50
Bearish below 50
Enjoy!
MM
보호된 스크립트입니다
이 스크립트는 비공개 소스로 게시됩니다. 하지만 이를 자유롭게 제한 없이 사용할 수 있습니다 – 자세한 내용은 여기에서 확인하세요.
면책사항
해당 정보와 게시물은 금융, 투자, 트레이딩 또는 기타 유형의 조언이나 권장 사항으로 간주되지 않으며, 트레이딩뷰에서 제공하거나 보증하는 것이 아닙니다. 자세한 내용은 이용 약관을 참조하세요.
보호된 스크립트입니다
이 스크립트는 비공개 소스로 게시됩니다. 하지만 이를 자유롭게 제한 없이 사용할 수 있습니다 – 자세한 내용은 여기에서 확인하세요.
면책사항
해당 정보와 게시물은 금융, 투자, 트레이딩 또는 기타 유형의 조언이나 권장 사항으로 간주되지 않으며, 트레이딩뷰에서 제공하거나 보증하는 것이 아닙니다. 자세한 내용은 이용 약관을 참조하세요.