OPEN-SOURCE SCRIPT
업데이트됨 Colored ADX with DI+/- and thresholds
Average Directional Index ( ADX )
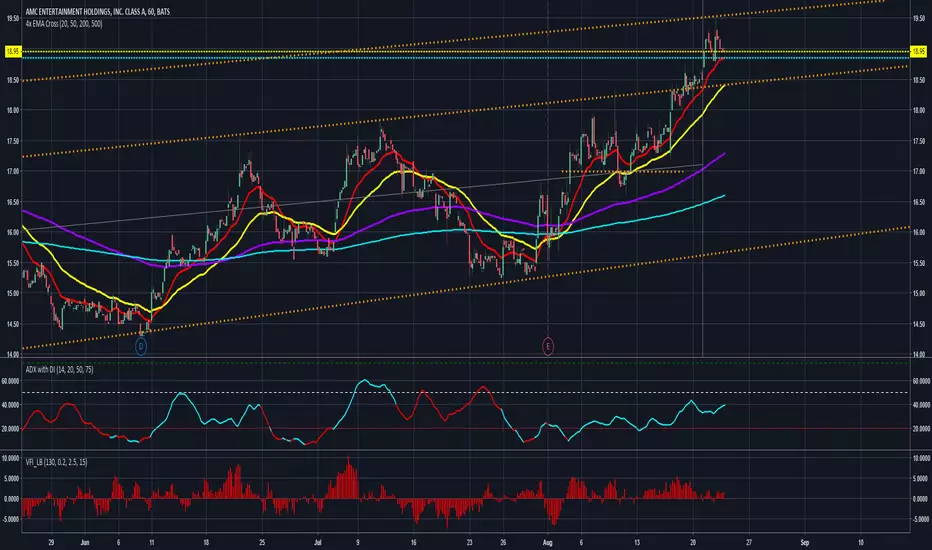
Based off of MasaNakamura's implementation, modified to show high & super-high momentum thresholds. In addition, coloring the trend line by the prevailing trend direction from the DI (Red if down, Green if up) allows you to remove the DI if you want to reduce chart clutter!
"The Average Directional Index (ADX), Minus Directional Indicator (-DI) and Plus Directional Indicator (+DI) represent a group of directional movement indicators that form a trading system developed by Welles Wilder....
The Plus Directional Indicator (+DI) and Minus Directional Indicator (-DI) are derived from smoothed averages of these differences, and measure trend direction over time. These two indicators are often referred to collectively as the Directional Movement Indicator (DMI).
The Average Directional Index (ADX) is in turn derived from the smoothed averages of the difference between +DI and -DI, and measures the strength of the trend (regardless of direction) over time.
Using these three indicators together, chartists can determine both the direction and strength of the trend....
At its most basic, the Average Directional Index (ADX) can be used to determine if a security is trending or not. This determination helps traders choose between a trend-following system or a non-trend-following system. Wilder suggests that a strong trend is present when ADX is above 20..."
See
investopedia.com/articles/trading/07/adx-trend-indicator.asp
stockcharts.com/school/doku.php?st=adx&id=chart_school:technical_indicators:average_directional_index_adx
for detail.
 AMD
AMD
There are more plans to add vertical lines on crosses and divergence indicators so stay tuned!
Thank you and good trading!
Based off of MasaNakamura's implementation, modified to show high & super-high momentum thresholds. In addition, coloring the trend line by the prevailing trend direction from the DI (Red if down, Green if up) allows you to remove the DI if you want to reduce chart clutter!
"The Average Directional Index (ADX), Minus Directional Indicator (-DI) and Plus Directional Indicator (+DI) represent a group of directional movement indicators that form a trading system developed by Welles Wilder....
The Plus Directional Indicator (+DI) and Minus Directional Indicator (-DI) are derived from smoothed averages of these differences, and measure trend direction over time. These two indicators are often referred to collectively as the Directional Movement Indicator (DMI).
The Average Directional Index (ADX) is in turn derived from the smoothed averages of the difference between +DI and -DI, and measures the strength of the trend (regardless of direction) over time.
Using these three indicators together, chartists can determine both the direction and strength of the trend....
At its most basic, the Average Directional Index (ADX) can be used to determine if a security is trending or not. This determination helps traders choose between a trend-following system or a non-trend-following system. Wilder suggests that a strong trend is present when ADX is above 20..."
See
investopedia.com/articles/trading/07/adx-trend-indicator.asp
stockcharts.com/school/doku.php?st=adx&id=chart_school:technical_indicators:average_directional_index_adx
for detail.
There are more plans to add vertical lines on crosses and divergence indicators so stay tuned!
Thank you and good trading!
릴리즈 노트
Added A color-correlation option to change colors based on the DI+/- to show the trend direction, or based on the threshold/magnitude of the trend오픈 소스 스크립트
트레이딩뷰의 진정한 정신에 따라, 이 스크립트의 작성자는 이를 오픈소스로 공개하여 트레이더들이 기능을 검토하고 검증할 수 있도록 했습니다. 작성자에게 찬사를 보냅니다! 이 코드는 무료로 사용할 수 있지만, 코드를 재게시하는 경우 하우스 룰이 적용된다는 점을 기억하세요.
면책사항
해당 정보와 게시물은 금융, 투자, 트레이딩 또는 기타 유형의 조언이나 권장 사항으로 간주되지 않으며, 트레이딩뷰에서 제공하거나 보증하는 것이 아닙니다. 자세한 내용은 이용 약관을 참조하세요.
오픈 소스 스크립트
트레이딩뷰의 진정한 정신에 따라, 이 스크립트의 작성자는 이를 오픈소스로 공개하여 트레이더들이 기능을 검토하고 검증할 수 있도록 했습니다. 작성자에게 찬사를 보냅니다! 이 코드는 무료로 사용할 수 있지만, 코드를 재게시하는 경우 하우스 룰이 적용된다는 점을 기억하세요.
면책사항
해당 정보와 게시물은 금융, 투자, 트레이딩 또는 기타 유형의 조언이나 권장 사항으로 간주되지 않으며, 트레이딩뷰에서 제공하거나 보증하는 것이 아닙니다. 자세한 내용은 이용 약관을 참조하세요.