OPEN-SOURCE SCRIPT
Linear Regression Volume Profile [ChartPrime]

LR VolumeProfile [ChartPrime]
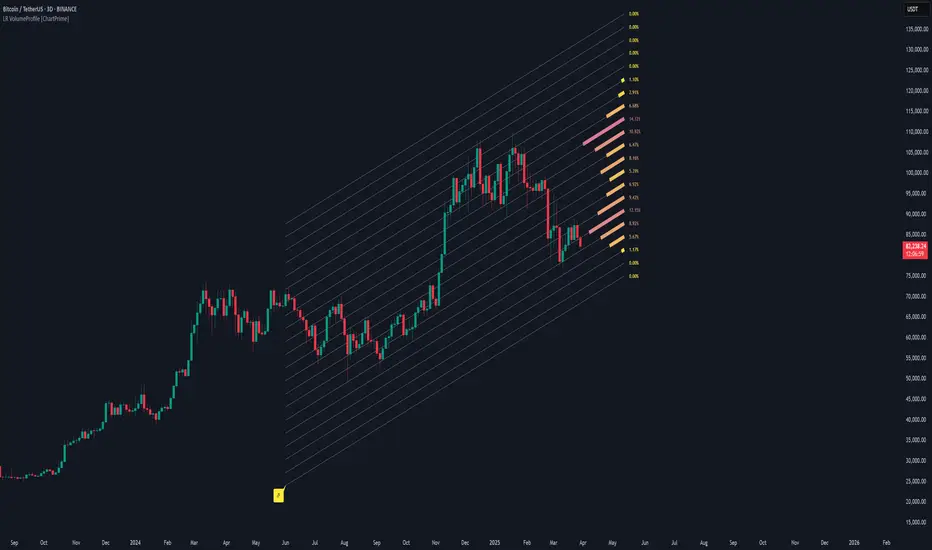
This indicator combines a Linear Regression channel with a dynamic volume profile, giving traders a powerful way to visualize both directional price movement and volume concentration along the trend.
⯁ KEY FEATURES
⯁ HOW TO USE
⯁ CONCLUSION
LR Volume Profile [ChartPrime] is a precision tool for traders who want to merge trend analysis with volume insight. By integrating linear regression trendlines with a clean and readable volume distribution, this indicator helps traders find price levels that matter the most—backed by volume, trend, and structure. Whether you're spotting high-volume nodes or gauging directional flow, this toolkit elevates your decision-making process with clarity and depth.
This indicator combines a Linear Regression channel with a dynamic volume profile, giving traders a powerful way to visualize both directional price movement and volume concentration along the trend.
⯁ KEY FEATURES
- Linear Regression Channel: Draws a statistically fitted channel to track the market trend over a defined period.
- Volume Profile Overlay: Splits the channel into multiple horizontal levels and calculates volume traded within each level.
- Percentage-Based Labels: Displays each level's share of total volume as a percentage, offering a clean way to see high and low volume zones.
- Gradient Bars: Profile bars are colored using a gradient scale from yellow (low volume) to red (high volume), making it easy to identify key interest areas.
- Adjustable Profile Width and Resolution: Users can change the width of profile bars and spacing between levels.
- Channel Direction Indicator: An arrow inside a floating label shows the direction (up or down) of the current linear regression slope.
- Level Style Customization: Choose from solid, dashed, or dotted lines for visual preference.
⯁ HOW TO USE
- Use the Linear Regression channel to determine the dominant price trend direction.
- Analyze the volume bars to spot key levels where the majority of volume was traded—these act as potential support/resistance zones.
- Pay attention to the largest profile bars—these often mark zones of institutional interest or price consolidation.
- The arrow label helps quickly assess whether the trend is upward or downward.
- Combine this tool with price action or momentum indicators to build high-confidence trading setups.
⯁ CONCLUSION
LR Volume Profile [ChartPrime] is a precision tool for traders who want to merge trend analysis with volume insight. By integrating linear regression trendlines with a clean and readable volume distribution, this indicator helps traders find price levels that matter the most—backed by volume, trend, and structure. Whether you're spotting high-volume nodes or gauging directional flow, this toolkit elevates your decision-making process with clarity and depth.
오픈 소스 스크립트
트레이딩뷰의 진정한 정신에 따라, 이 스크립트의 작성자는 이를 오픈소스로 공개하여 트레이더들이 기능을 검토하고 검증할 수 있도록 했습니다. 작성자에게 찬사를 보냅니다! 이 코드는 무료로 사용할 수 있지만, 코드를 재게시하는 경우 하우스 룰이 적용된다는 점을 기억하세요.
면책사항
해당 정보와 게시물은 금융, 투자, 트레이딩 또는 기타 유형의 조언이나 권장 사항으로 간주되지 않으며, 트레이딩뷰에서 제공하거나 보증하는 것이 아닙니다. 자세한 내용은 이용 약관을 참조하세요.
오픈 소스 스크립트
트레이딩뷰의 진정한 정신에 따라, 이 스크립트의 작성자는 이를 오픈소스로 공개하여 트레이더들이 기능을 검토하고 검증할 수 있도록 했습니다. 작성자에게 찬사를 보냅니다! 이 코드는 무료로 사용할 수 있지만, 코드를 재게시하는 경우 하우스 룰이 적용된다는 점을 기억하세요.
면책사항
해당 정보와 게시물은 금융, 투자, 트레이딩 또는 기타 유형의 조언이나 권장 사항으로 간주되지 않으며, 트레이딩뷰에서 제공하거나 보증하는 것이 아닙니다. 자세한 내용은 이용 약관을 참조하세요.