PROTECTED SOURCE SCRIPT
업데이트됨 RSIEW V2 Thermal Falsecolor show Hot (Impulse) Cold (Correction)
HI BIG PLAYER AROUND THE WORLD,
here is my new creation of modified RSI Indikator.
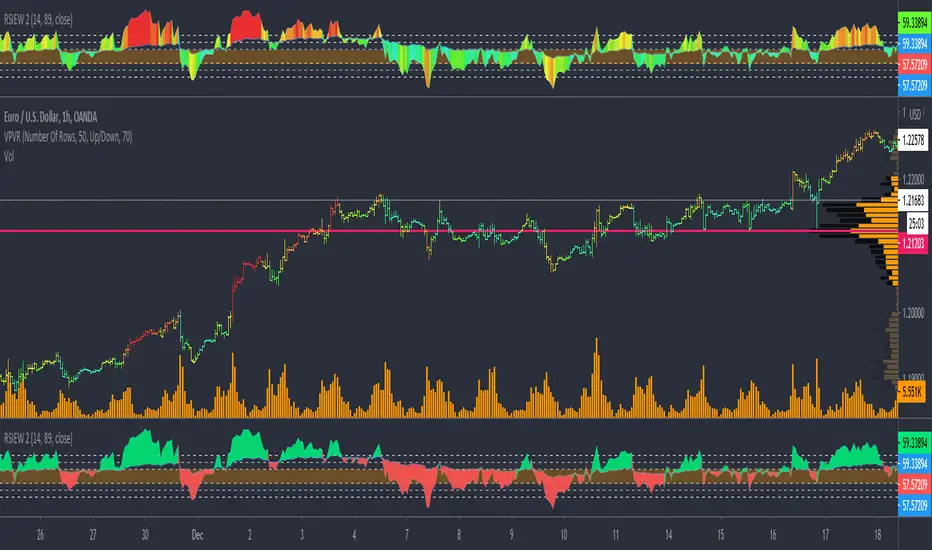
In order to the RSIEW Version 1 (look below this text) I build a thermal rainbow chart that shows the spectrum with all overbought and oversell phases. The colour spectrum can be compared with a thermal imaging camera.
In one hand, the hottest candles (going into red) show the extrem points of the chart. In trend direction this is often wave 3 of Elliott Waves theory and in correction phase it show the bounce period.
In other hand, the coldest candles (going into blue) show the weak points of the chart. In trend direction this is often a "cooling down" and in big correction phases it demonstrate frozen prices (really unattractive trading time).
Have fun with this and give me a feedback.
Of course, you are invited to follow me.
KIND REGARDS
NXT2017
here is my new creation of modified RSI Indikator.
In order to the RSIEW Version 1 (look below this text) I build a thermal rainbow chart that shows the spectrum with all overbought and oversell phases. The colour spectrum can be compared with a thermal imaging camera.
In one hand, the hottest candles (going into red) show the extrem points of the chart. In trend direction this is often wave 3 of Elliott Waves theory and in correction phase it show the bounce period.
In other hand, the coldest candles (going into blue) show the weak points of the chart. In trend direction this is often a "cooling down" and in big correction phases it demonstrate frozen prices (really unattractive trading time).
Have fun with this and give me a feedback.
Of course, you are invited to follow me.
KIND REGARDS
NXT2017
릴리즈 노트
- add manually color choose functions- fixed bugs on color
보호된 스크립트입니다
이 스크립트는 비공개 소스로 게시됩니다. 하지만 이를 자유롭게 제한 없이 사용할 수 있습니다 – 자세한 내용은 여기에서 확인하세요.
🐺 Wolfe Wave AutoPattern: nxt2017.com/ww
🎯 Elliott Wave Auto Counting: nxt2017.com/ew
💥 Impulse Scalper: nxt2017.com/im
📈 Cheapest Entry: nxt2017.com/pi
Discount Coupon:
nxtcoupon20 for -20%
🎯 Elliott Wave Auto Counting: nxt2017.com/ew
💥 Impulse Scalper: nxt2017.com/im
📈 Cheapest Entry: nxt2017.com/pi
Discount Coupon:
nxtcoupon20 for -20%
면책사항
해당 정보와 게시물은 금융, 투자, 트레이딩 또는 기타 유형의 조언이나 권장 사항으로 간주되지 않으며, 트레이딩뷰에서 제공하거나 보증하는 것이 아닙니다. 자세한 내용은 이용 약관을 참조하세요.