OPEN-SOURCE SCRIPT
업데이트됨 Key Session Levels | Highs, Lows, Opens

Overview
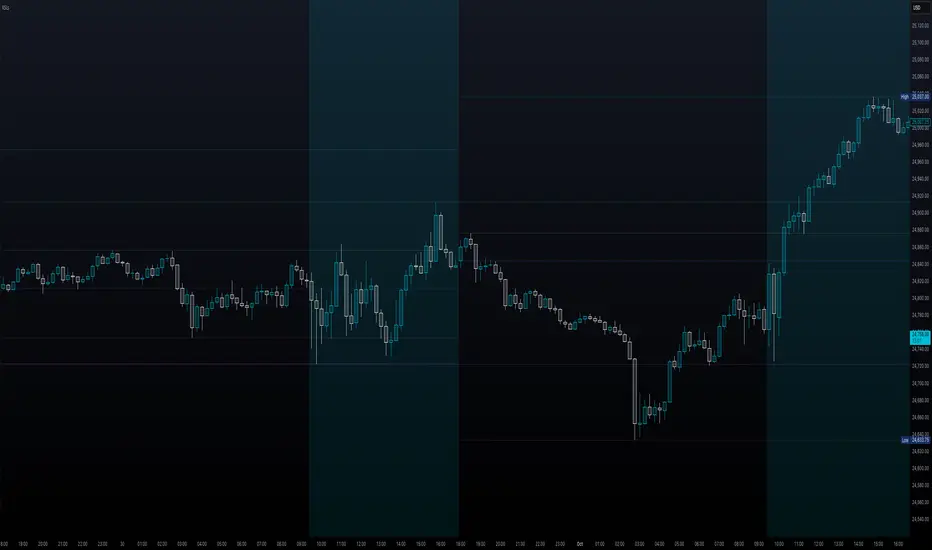
Designed for scalping and intraday trading on ES, NQ, and other futures markets that trade around the clock, this indicator automatically plots key support/resistance levels:
Session Definitions (America/New_York Time)
Session (18:00 - 16:59 ET)
Overnight Session (18:00 - 9:30 ET)
NY Session (9:30 - 16:59 ET)
Key Features
Flexible Extension Modes
Smart Line Management
Full Customization
Common Use Cases
Strategy
Best Timeframes
Works on any intraday timeframe, optimized for: 1m, 5m, 15m, 30m, 1H
Notes
Designed for scalping and intraday trading on ES, NQ, and other futures markets that trade around the clock, this indicator automatically plots key support/resistance levels:
- Session opens
- Session highs
- Session lows
- Overnight highs
- Overnight lows
Session Definitions (America/New_York Time)
Session (18:00 - 16:59 ET)
- Tracks complete trading cycle
- Plots: High, Low
- Represents true daily extremes of each session
Overnight Session (18:00 - 9:30 ET)
- Captures Asian and European session price action
- Plots: Open, High, Low
- These levels can act as support/resistance during the NY session
NY Session (9:30 - 16:59 ET)
- Optional background highlight for regular trading hours
- Helps visually distinguish active NY session from overnight action
Key Features
Flexible Extension Modes
- Same Day: Lines end at session close
- Next Day: Lines extend through the following session
- Full Chart: Lines extend indefinitely to the right
Smart Line Management
- Optional extension of overnight levels through NY session
- Control how many historical sessions to display (1-250)
- Automatic cleanup of old lines
Full Customization
- Individual color control for each level
- Line style options (solid, dotted, dashed)
- Line width adjustment (1px-4px)
- Show/hide any level independently
Common Use Cases
- Support/Resistance
- Breakout/Break & Retest
Strategy
- Wait for price to reach a key level
- Use Level 2 data to determine who's in control at the level (e.g. aggressive buyers vs. passive sellers) *this requires third-party software and a live data feed
- Enter long/short WITH institutional players, identified via Level 2 data
- Target areas/levels where the market may reverse
Best Timeframes
Works on any intraday timeframe, optimized for: 1m, 5m, 15m, 30m, 1H
Notes
- All times are in America/New_York (Eastern Time)
- Requires intraday timeframe to detect specific session times
- Lines are semi-transparent by default for better chart visibility
릴리즈 노트
OverviewDesigned for scalping and intraday trading on ES, NQ, and other futures markets that trade around the clock, this indicator automatically plots key support/resistance levels:
- Session opens
- Session highs
- Session lows
- Overnight highs
- Overnight lows
Session Definitions (America/New_York Time)
Session (18:00 - 16:59 ET)
- Tracks complete trading cycle
- Plots: High, Low
- Represents true daily extremes of each session
Overnight Session (18:00 - 9:30 ET)
- Captures Asian and European session price action
- Plots: Open, High, Low
- These levels can act as support/resistance during the NY session
NY Session (9:30 - 16:59 ET)
- Optional background highlight for regular trading hours
- Helps visually distinguish active NY session from overnight action
Key Features
Flexible Extension Modes
- Same Day: Lines end at session close
- Next Day: Lines extend through the following session
- Full Chart: Lines extend indefinitely to the right
Smart Line Management
- Optional extension of overnight levels through NY session
- Control how many historical sessions to display (1-250)
- Automatic cleanup of old lines
Full Customization
- Individual color control for each level
- Line style options (solid, dotted, dashed)
- Line width adjustment (1px-4px)
- Show/hide any level independently
Common Use Cases
- Support/Resistance
- Breakout/Break & Retest
Strategy
- Wait for price to reach a key level
- Use Level 2 data to determine who's in control at the level (e.g. aggressive buyers vs. passive sellers) *this requires third-party software and a live data feed
- Enter long/short WITH institutional players, identified via Level 2 data
- Target areas/levels where the market may reverse
Best Timeframes
Works on any intraday timeframe, optimized for: 1m, 5m, 15m, 30m, 1H
Notes
- All times are in America/New_York (Eastern Time)
- Requires intraday timeframe to detect specific session times
- Lines are semi-transparent by default for better chart visibility
Changelog
V 1.1
Updated overnight session calculation; now accurately plots overnight high and low on timeframes above 1m.
릴리즈 노트
V 1.1Updated overnight session calculation; now accurately plots overnight high and low on timeframes ab
릴리즈 노트
v1.2Updated session calculation; now accurately shows session high and low on timeframes above 1m.
릴리즈 노트
v1.3Added realtime overnight session high and low plotting.
릴리즈 노트
v1.3.1Updated indicator name for SEO.
오픈 소스 스크립트
진정한 트레이딩뷰 정신에 따라 이 스크립트 작성자는 트레이더가 기능을 검토하고 검증할 수 있도록 오픈소스로 공개했습니다. 작성자에게 찬사를 보냅니다! 무료로 사용할 수 있지만 코드를 다시 게시할 경우 하우스 룰이 적용된다는 점을 기억하세요.
면책사항
이 정보와 게시물은 TradingView에서 제공하거나 보증하는 금융, 투자, 거래 또는 기타 유형의 조언이나 권고 사항을 의미하거나 구성하지 않습니다. 자세한 내용은 이용 약관을 참고하세요.
오픈 소스 스크립트
진정한 트레이딩뷰 정신에 따라 이 스크립트 작성자는 트레이더가 기능을 검토하고 검증할 수 있도록 오픈소스로 공개했습니다. 작성자에게 찬사를 보냅니다! 무료로 사용할 수 있지만 코드를 다시 게시할 경우 하우스 룰이 적용된다는 점을 기억하세요.
면책사항
이 정보와 게시물은 TradingView에서 제공하거나 보증하는 금융, 투자, 거래 또는 기타 유형의 조언이나 권고 사항을 의미하거나 구성하지 않습니다. 자세한 내용은 이용 약관을 참고하세요.