PROTECTED SOURCE SCRIPT
Bulls vs Bears % Box
Bulls vs Bears % Box
What it does
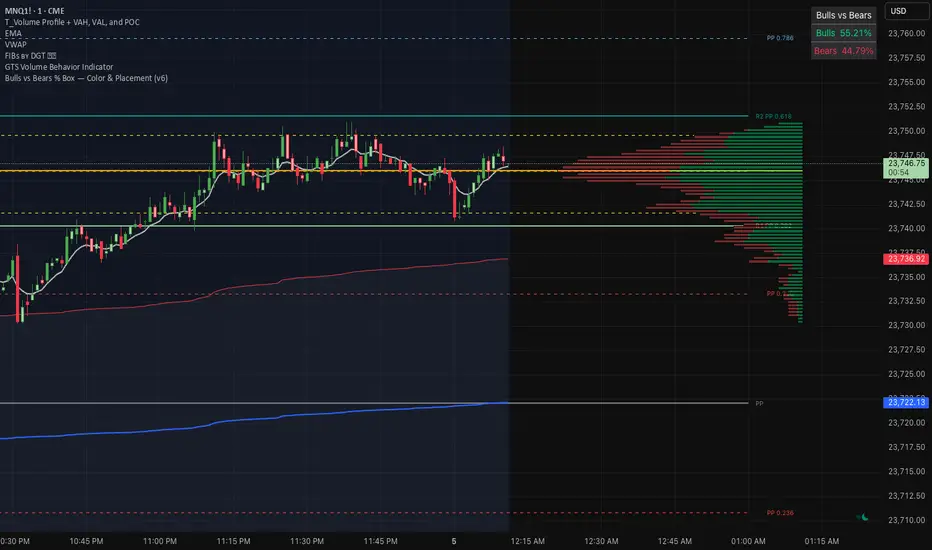
A compact on-chart box that shows the percentage of volume attributed to Bulls vs Bears over a window you choose. It’s a quick market-internals glance: who’s in control right now, by how much, and does the imbalance warrant caution or opportunity.
Why use it
Fast read of intraday momentum and exhaustion.
Confirms trend strength or flags pullback risk when one side dominates.
Works on any symbol/timeframe with volume.
How it works (simple)
The indicator splits each bar’s volume into “bull” or “bear” using one of four rules (you choose):
Tick-Rule (close vs prev close) – responsive in chop (default).
Body (close vs open) – classic candle color approach.
Heikin-Ashi Body – smoother trend read.
VWAP (close vs vwap) – bullish if price is above VWAP on the bar.
Dojis can be split 50/50 (optional). The box then displays the rolling or session-cumulated bull/bear percentages.
Settings
Window:
Session (RTH) – resets each regular session (you can edit hours/days).
Rolling N Bars – moving total over the last N bars.
Direction Rule: Tick-Rule, Body, Heikin-Ashi Body, or VWAP.
Doji Handling: Split doji volume 50/50 (on/off).
Placement: 9 anchors (Top/Middle/Bottom × Left/Center/Right).
Colors: Customize header, background, border, and text (dominant vs sub).
How to read it
Bulls % > Bears % → buyer dominance; trend continuation more likely.
Bears % > Bulls % → seller dominance; watch for lower highs/continuation.
Extreme imbalance (e.g., >60–70% one side) → strong push but also pullback risk soon.
Tip: Pair it with VWAP, your EMA, or structure levels. Use the same window and rule each day for consistency.
Notes & Limitations
Uses volume-based inference, not true bid/ask delta (which TradingView doesn’t provide).
Results vary by rule/window; pick the one that matches your playbook.
Requires symbols/timeframes with volume data.
Best Practices
Intraday futures/indices: Session (RTH) + Tick-Rule is a solid starting point.
Trend trading: try Heikin-Ashi Body for smoother dominance signals.
Mean-reversion: watch for extremes flipping toward balance.
Credits: Built for clarity, speed, and flexibility. Customize colors and placement to fit your layout.
What it does
A compact on-chart box that shows the percentage of volume attributed to Bulls vs Bears over a window you choose. It’s a quick market-internals glance: who’s in control right now, by how much, and does the imbalance warrant caution or opportunity.
Why use it
Fast read of intraday momentum and exhaustion.
Confirms trend strength or flags pullback risk when one side dominates.
Works on any symbol/timeframe with volume.
How it works (simple)
The indicator splits each bar’s volume into “bull” or “bear” using one of four rules (you choose):
Tick-Rule (close vs prev close) – responsive in chop (default).
Body (close vs open) – classic candle color approach.
Heikin-Ashi Body – smoother trend read.
VWAP (close vs vwap) – bullish if price is above VWAP on the bar.
Dojis can be split 50/50 (optional). The box then displays the rolling or session-cumulated bull/bear percentages.
Settings
Window:
Session (RTH) – resets each regular session (you can edit hours/days).
Rolling N Bars – moving total over the last N bars.
Direction Rule: Tick-Rule, Body, Heikin-Ashi Body, or VWAP.
Doji Handling: Split doji volume 50/50 (on/off).
Placement: 9 anchors (Top/Middle/Bottom × Left/Center/Right).
Colors: Customize header, background, border, and text (dominant vs sub).
How to read it
Bulls % > Bears % → buyer dominance; trend continuation more likely.
Bears % > Bulls % → seller dominance; watch for lower highs/continuation.
Extreme imbalance (e.g., >60–70% one side) → strong push but also pullback risk soon.
Tip: Pair it with VWAP, your EMA, or structure levels. Use the same window and rule each day for consistency.
Notes & Limitations
Uses volume-based inference, not true bid/ask delta (which TradingView doesn’t provide).
Results vary by rule/window; pick the one that matches your playbook.
Requires symbols/timeframes with volume data.
Best Practices
Intraday futures/indices: Session (RTH) + Tick-Rule is a solid starting point.
Trend trading: try Heikin-Ashi Body for smoother dominance signals.
Mean-reversion: watch for extremes flipping toward balance.
Credits: Built for clarity, speed, and flexibility. Customize colors and placement to fit your layout.
보호된 스크립트입니다
이 스크립트는 비공개 소스로 게시됩니다. 하지만 이를 자유롭게 제한 없이 사용할 수 있습니다 – 자세한 내용은 여기에서 확인하세요.
면책사항
해당 정보와 게시물은 금융, 투자, 트레이딩 또는 기타 유형의 조언이나 권장 사항으로 간주되지 않으며, 트레이딩뷰에서 제공하거나 보증하는 것이 아닙니다. 자세한 내용은 이용 약관을 참조하세요.
보호된 스크립트입니다
이 스크립트는 비공개 소스로 게시됩니다. 하지만 이를 자유롭게 제한 없이 사용할 수 있습니다 – 자세한 내용은 여기에서 확인하세요.
면책사항
해당 정보와 게시물은 금융, 투자, 트레이딩 또는 기타 유형의 조언이나 권장 사항으로 간주되지 않으며, 트레이딩뷰에서 제공하거나 보증하는 것이 아닙니다. 자세한 내용은 이용 약관을 참조하세요.