OPEN-SOURCE SCRIPT
Volatility Forecast
/*==============================================================================
Volatility Forecast — Publishable Documentation
Author: BB_9791
License: Mozilla Public License 2.0
WHAT THIS INDICATOR SHOWS
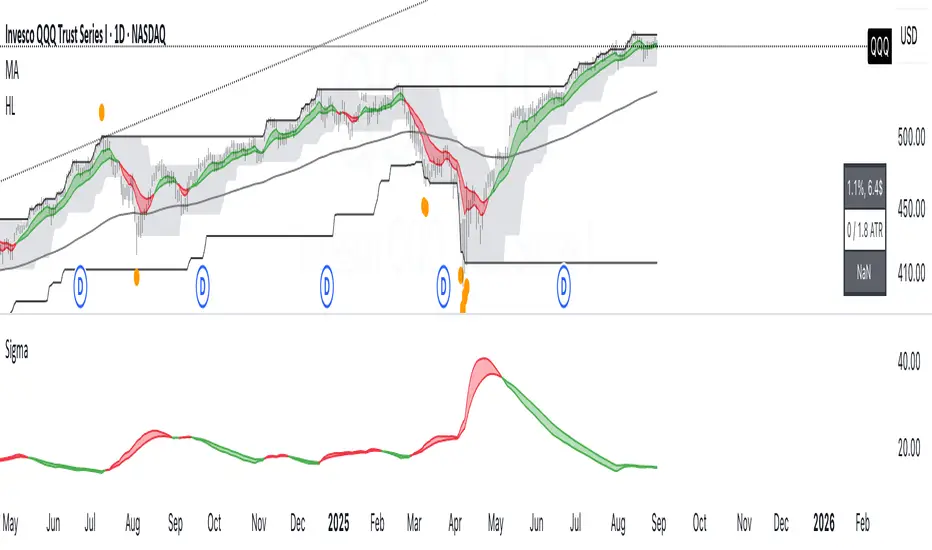
- A daily volatility estimate in percent points, called sigma_day.
- A slow volatility anchor, the 10-year EMA of sigma_day.
- A blended volatility series in percent points:
sigma_blend = (1 − p) * sigma_day + p * EMA_10y(sigma_day)
where p is the Slow weight %, default 30.
- Optional annualization by multiplying by 16, this is a daily-to-annual
conversion used by Robert Carver in his writings.
METHODOLOGY, CREDIT
The estimator follows the approach popularized by Robert Carver
("Systematic Trading", "Advanced Futures Trading Strategies", blog qoppac).
Current daily volatility is computed as an exponentially weighted standard
deviation of daily percent returns, with alpha = 2 / (span + 1).
The slow leg is a long EMA of that volatility series, about 10 years.
The blend uses fixed weights. This keeps the slow leg meaningful through
large price level changes, since the blend is done in percent space first.
MATH DETAILS
Let r_t be daily percent return:
r_t = 100 * (Close_t / Close_{t−1} − 1)
EWMA mean and variance:
m_t = α * r_t + (1 − α) * m_{t−1}
v_t = α * (r_t − m_t)^2 + (1 − α) * v_{t−1}
where α = 2 / (span_current + 1)
Current daily sigma in percent points:
sigma_day = sqrt(v_t)
Slow leg:
sigma_10y = EMA(sigma_day, span_long)
Blend:
sigma_blend = (1 − p) * sigma_day + p * sigma_10y
Annualized option:
sigma_ann = 16 * sigma_blend
INPUTS
- Threshold (percent points): horizontal guide level on the chart.
- Short term span (days): EW stdev span for sigma_day.
- Long term span (days): EMA span for the slow leg, choose about 2500 for 10 years.
- Slow weight %: p in the blend.
- Annualize (x16): plot daily or annualized values.
- Show components: toggles Current and 10y EMA lines.
- The script uses the chart symbol by default.
PLOTS
- Blended σ% as the main line.
- Optional Current σ% and 10y EMA σ%.
- Editable horizontal threshold line in the same units as the plot
(percent points per day or per year).
- Optional EMA 9 and EMA 20 cloud on the blended series, green for uptrend
when EMA 9 is above EMA 20, red otherwise. Opacity is configurable.
HOW TO READ
- Values are percent points of movement per day when not annualized,
for example 1.2 means about 1.2% typical daily move.
- With annualize checked, values are percent points per year, for example 18
means about 18% annualized volatility.
- Use the threshold and the EMA cloud to mark high or low volatility regimes.
NOTES
- All calculations use daily data via request.security at the chart symbol.
- The blend is done in percent space, then optionally annualized, which avoids
bias from the price level.
- This script does not produce trading signals by itself, it is a risk and
regime indicator.
CREDITS
Volatility forecasting method and scaling convention credited to Robert Carver.
See his books and blog for background and parameter choices.
VERSION
v1.0 Initial public release.
==============================================================================*/
Volatility Forecast — Publishable Documentation
Author: BB_9791
License: Mozilla Public License 2.0
WHAT THIS INDICATOR SHOWS
- A daily volatility estimate in percent points, called sigma_day.
- A slow volatility anchor, the 10-year EMA of sigma_day.
- A blended volatility series in percent points:
sigma_blend = (1 − p) * sigma_day + p * EMA_10y(sigma_day)
where p is the Slow weight %, default 30.
- Optional annualization by multiplying by 16, this is a daily-to-annual
conversion used by Robert Carver in his writings.
METHODOLOGY, CREDIT
The estimator follows the approach popularized by Robert Carver
("Systematic Trading", "Advanced Futures Trading Strategies", blog qoppac).
Current daily volatility is computed as an exponentially weighted standard
deviation of daily percent returns, with alpha = 2 / (span + 1).
The slow leg is a long EMA of that volatility series, about 10 years.
The blend uses fixed weights. This keeps the slow leg meaningful through
large price level changes, since the blend is done in percent space first.
MATH DETAILS
Let r_t be daily percent return:
r_t = 100 * (Close_t / Close_{t−1} − 1)
EWMA mean and variance:
m_t = α * r_t + (1 − α) * m_{t−1}
v_t = α * (r_t − m_t)^2 + (1 − α) * v_{t−1}
where α = 2 / (span_current + 1)
Current daily sigma in percent points:
sigma_day = sqrt(v_t)
Slow leg:
sigma_10y = EMA(sigma_day, span_long)
Blend:
sigma_blend = (1 − p) * sigma_day + p * sigma_10y
Annualized option:
sigma_ann = 16 * sigma_blend
INPUTS
- Threshold (percent points): horizontal guide level on the chart.
- Short term span (days): EW stdev span for sigma_day.
- Long term span (days): EMA span for the slow leg, choose about 2500 for 10 years.
- Slow weight %: p in the blend.
- Annualize (x16): plot daily or annualized values.
- Show components: toggles Current and 10y EMA lines.
- The script uses the chart symbol by default.
PLOTS
- Blended σ% as the main line.
- Optional Current σ% and 10y EMA σ%.
- Editable horizontal threshold line in the same units as the plot
(percent points per day or per year).
- Optional EMA 9 and EMA 20 cloud on the blended series, green for uptrend
when EMA 9 is above EMA 20, red otherwise. Opacity is configurable.
HOW TO READ
- Values are percent points of movement per day when not annualized,
for example 1.2 means about 1.2% typical daily move.
- With annualize checked, values are percent points per year, for example 18
means about 18% annualized volatility.
- Use the threshold and the EMA cloud to mark high or low volatility regimes.
NOTES
- All calculations use daily data via request.security at the chart symbol.
- The blend is done in percent space, then optionally annualized, which avoids
bias from the price level.
- This script does not produce trading signals by itself, it is a risk and
regime indicator.
CREDITS
Volatility forecasting method and scaling convention credited to Robert Carver.
See his books and blog for background and parameter choices.
VERSION
v1.0 Initial public release.
==============================================================================*/
오픈 소스 스크립트
트레이딩뷰의 진정한 정신에 따라, 이 스크립트의 작성자는 이를 오픈소스로 공개하여 트레이더들이 기능을 검토하고 검증할 수 있도록 했습니다. 작성자에게 찬사를 보냅니다! 이 코드는 무료로 사용할 수 있지만, 코드를 재게시하는 경우 하우스 룰이 적용된다는 점을 기억하세요.
면책사항
해당 정보와 게시물은 금융, 투자, 트레이딩 또는 기타 유형의 조언이나 권장 사항으로 간주되지 않으며, 트레이딩뷰에서 제공하거나 보증하는 것이 아닙니다. 자세한 내용은 이용 약관을 참조하세요.
오픈 소스 스크립트
트레이딩뷰의 진정한 정신에 따라, 이 스크립트의 작성자는 이를 오픈소스로 공개하여 트레이더들이 기능을 검토하고 검증할 수 있도록 했습니다. 작성자에게 찬사를 보냅니다! 이 코드는 무료로 사용할 수 있지만, 코드를 재게시하는 경우 하우스 룰이 적용된다는 점을 기억하세요.
면책사항
해당 정보와 게시물은 금융, 투자, 트레이딩 또는 기타 유형의 조언이나 권장 사항으로 간주되지 않으며, 트레이딩뷰에서 제공하거나 보증하는 것이 아닙니다. 자세한 내용은 이용 약관을 참조하세요.