PROTECTED SOURCE SCRIPT
Daily % Change Matrix
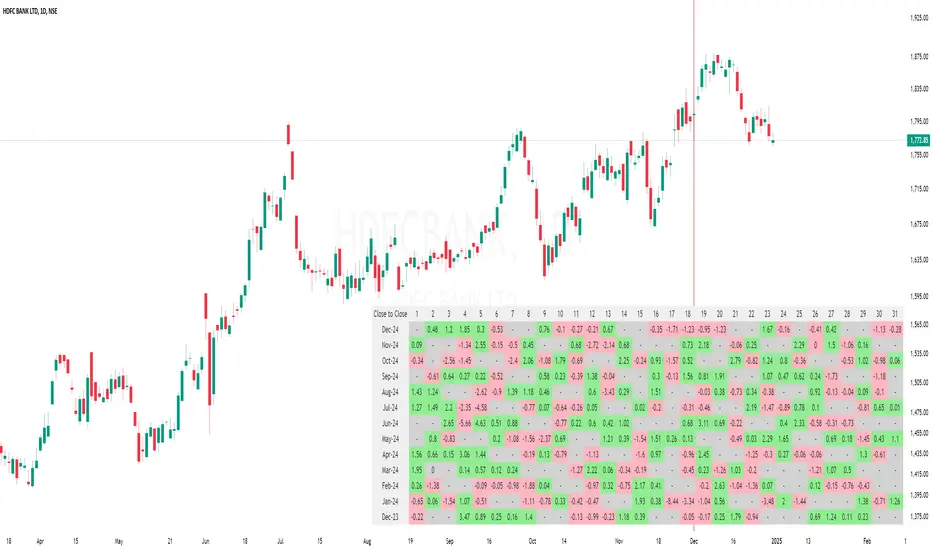
The "Daily % Change Matrix" is a powerful tool designed to visualize daily percentage changes in stock prices. This indicator helps traders analyze trends and volatility over time, enabling data-driven decisions.
Features
Change Calculation Options:
Choose between two methods:
Previous Close to Current Close: Calculates the percent change from the previous day's close to the current day's close.
Open to Close: Calculates the percent change from the current day's open to its close.
Customizable Table Display:
Size Options: Choose between Small, Normal, and Large.
Positioning: Place the table in any corner of the chart (Top Left, Top Right, Bottom Left, or Bottom Right).
Color Coding:
Green: Positive changes.
Red: Negative changes.
Grey: No data or negligible changes.
Table Details
Rows: Days of the month (1-31).
Columns: The last 13 months of data.
Dynamic Header: Automatically updates based on the selected calculation method.
Usage
Change your chart timeframe to Daily (D).
Configure the table's size and position via inputs.
Select the preferred calculation method.
Ideal For
Swing Traders: Identify monthly performance trends.
Analysts: Study long-term patterns across months.
Portfolio Managers: Gain insights into market behavior during specific periods.
Notes
Ensure the timeframe is set to Daily.
Use the table options to adjust for personal preference and chart space.
Contact
For any issues or suggestions, reach out to me.
보호된 스크립트입니다
이 스크립트는 비공개 소스로 게시됩니다. 하지만 이를 자유롭게 제한 없이 사용할 수 있습니다 – 자세한 내용은 여기에서 확인하세요.
면책사항
해당 정보와 게시물은 금융, 투자, 트레이딩 또는 기타 유형의 조언이나 권장 사항으로 간주되지 않으며, 트레이딩뷰에서 제공하거나 보증하는 것이 아닙니다. 자세한 내용은 이용 약관을 참조하세요.
면책사항
해당 정보와 게시물은 금융, 투자, 트레이딩 또는 기타 유형의 조언이나 권장 사항으로 간주되지 않으며, 트레이딩뷰에서 제공하거나 보증하는 것이 아닙니다. 자세한 내용은 이용 약관을 참조하세요.