PROTECTED SOURCE SCRIPT
업데이트됨 Probabilistic Trend Indicator
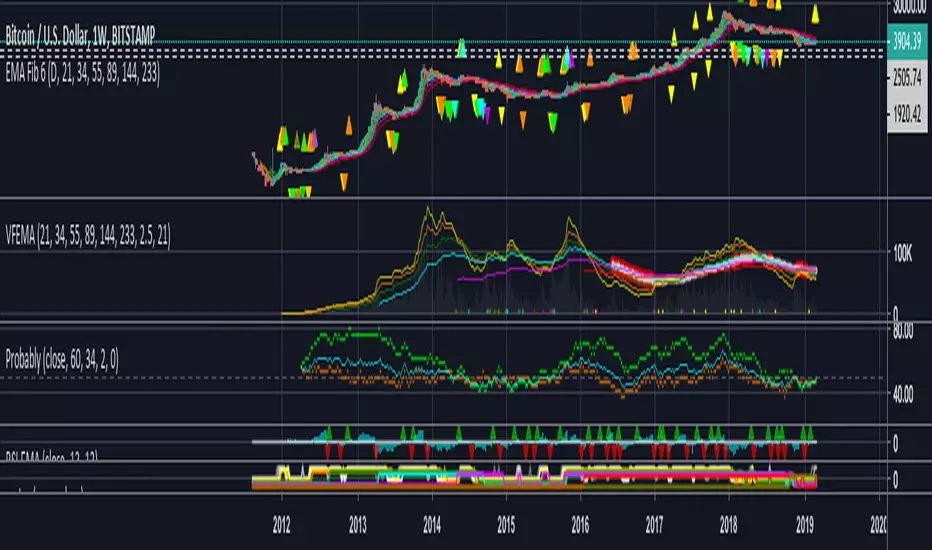
An indicator which attempts to assert the probability of the trend based on a given Sample Size and Look-Back Confirmation Size.
The green dots indicate the probability given to price.
The orange dots indicate the probability given to volume.
The aqua line is a weighted average between them.
The Sample Size is the number of candles to include in the entire calculation.
- This number should be higher to gather more data.
The Look-Back Confirmation Size is the number of candles to include, to confirm the current candles relative strength.
- This number should be lower to give a stronger closer relative reading.
Values above 50 indicate a strengthening position toward prices increasing.
- The strength of this value is weakly exponential and may max out around 80
Values below 50 indicate a strengthening position toward prices decreasing.
- The strength of this value is weakly exponential and may max out around 20
~ Enjoy!
릴리즈 노트
~ Updates default Sample Size to be slightly smaller+ Adds quality-of-life feature to smooth the Average (this is an EMA applied to the average line)
릴리즈 노트
NOTE: This indicator denotes the probability that the next candle will be greater than the previous (it does not denote the magnitude of how much greater it will be, just the likelihood).+ Adds the ability to change the source timeframe
릴리즈 노트
+ Adds the ability to gather samples from an alternative timeframe.+ Adds the ability to toggle the alternate timeframe setting.
+ Adds the ability to toggle the weighting of the average.
보호된 스크립트입니다
이 스크립트는 비공개 소스로 게시됩니다. 하지만 이를 자유롭게 제한 없이 사용할 수 있습니다 – 자세한 내용은 여기에서 확인하세요.
면책사항
해당 정보와 게시물은 금융, 투자, 트레이딩 또는 기타 유형의 조언이나 권장 사항으로 간주되지 않으며, 트레이딩뷰에서 제공하거나 보증하는 것이 아닙니다. 자세한 내용은 이용 약관을 참조하세요.
보호된 스크립트입니다
이 스크립트는 비공개 소스로 게시됩니다. 하지만 이를 자유롭게 제한 없이 사용할 수 있습니다 – 자세한 내용은 여기에서 확인하세요.
면책사항
해당 정보와 게시물은 금융, 투자, 트레이딩 또는 기타 유형의 조언이나 권장 사항으로 간주되지 않으며, 트레이딩뷰에서 제공하거나 보증하는 것이 아닙니다. 자세한 내용은 이용 약관을 참조하세요.