OPEN-SOURCE SCRIPT
업데이트됨 MA and Channel overlay
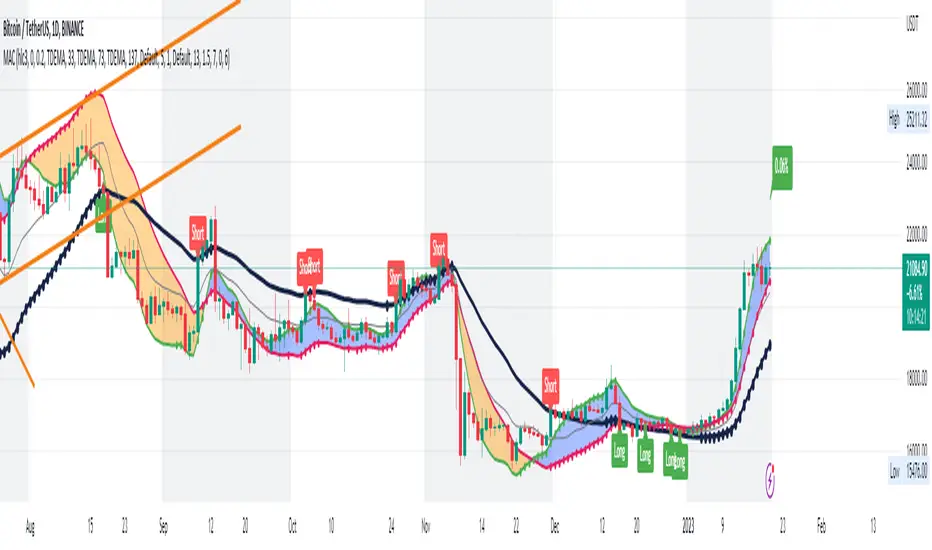
Some overlay utilities:
- Draw 3 moving averages (MA) with circles line.
- Option to choose type of MA to plot.
- Draw start point of those MA with a big cross.
- Option to draw channel: Donchian, Bollinger and Envelope.
- Option to draw stop loss line: ATR or Percentage.
- Draw background color in monthly, weekly, daily, intraday, ... chart (remember to choose your correct timezone if using intraday chart).
- Draw a label of last price.
- Draw next prices.
릴리즈 노트
Added comments and showed stop loss line for demo purpose.릴리즈 노트
Option to show / hide MAs.릴리즈 노트
New chart view.릴리즈 노트
Add intraday labels which show day number in month and weekday name.릴리즈 노트
Add hour range to draw sleep time in intraday chart.릴리즈 노트
Fixed time zone issue for exchange that has non-UTC timezone.릴리즈 노트
Fix weekly background issue.릴리즈 노트
Fix channel len issue.릴리즈 노트
- Use TDEMA as the default MA now.- Use bigger periods to catch trend easier.
- Drawed a band between small and medium period (MA1 and MA2) lines.
- The position of this band and the big period line (MA3) is the key to check the trend now.
오픈 소스 스크립트
트레이딩뷰의 진정한 정신에 따라, 이 스크립트의 작성자는 이를 오픈소스로 공개하여 트레이더들이 기능을 검토하고 검증할 수 있도록 했습니다. 작성자에게 찬사를 보냅니다! 이 코드는 무료로 사용할 수 있지만, 코드를 재게시하는 경우 하우스 룰이 적용된다는 점을 기억하세요.
면책사항
해당 정보와 게시물은 금융, 투자, 트레이딩 또는 기타 유형의 조언이나 권장 사항으로 간주되지 않으며, 트레이딩뷰에서 제공하거나 보증하는 것이 아닙니다. 자세한 내용은 이용 약관을 참조하세요.
오픈 소스 스크립트
트레이딩뷰의 진정한 정신에 따라, 이 스크립트의 작성자는 이를 오픈소스로 공개하여 트레이더들이 기능을 검토하고 검증할 수 있도록 했습니다. 작성자에게 찬사를 보냅니다! 이 코드는 무료로 사용할 수 있지만, 코드를 재게시하는 경우 하우스 룰이 적용된다는 점을 기억하세요.
면책사항
해당 정보와 게시물은 금융, 투자, 트레이딩 또는 기타 유형의 조언이나 권장 사항으로 간주되지 않으며, 트레이딩뷰에서 제공하거나 보증하는 것이 아닙니다. 자세한 내용은 이용 약관을 참조하세요.