PROTECTED SOURCE SCRIPT
업데이트됨 4H-50/50 Method
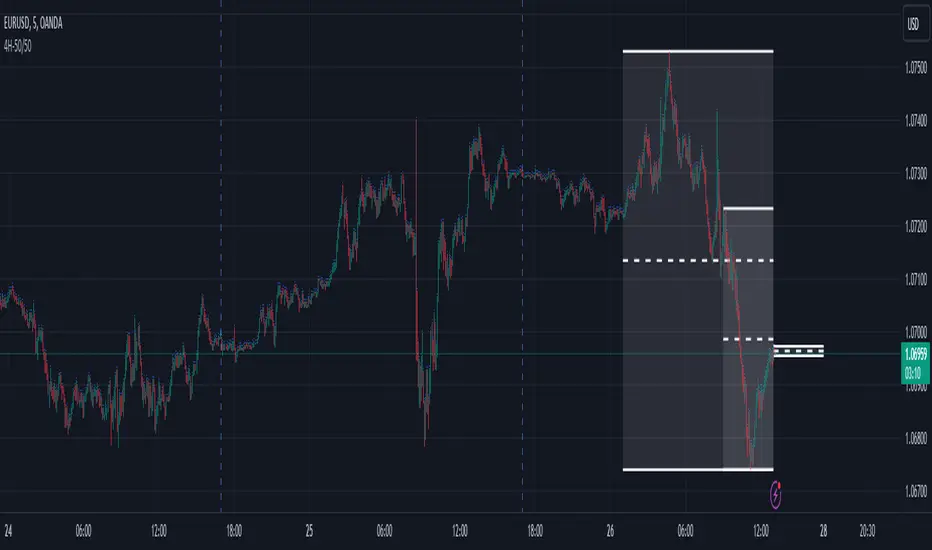
4H-50/50 tool is a way to visualize top down analysis.
• There are three boxes illustrated on the chart
- One box shows the past 4 hour time frame's high, low and center
- One box shows the past 12 hour time frame's high, low and center
- The last box is the current 4 hour time frame's high, low and center
• Four hour blocks start on specific hours 1, 5, 9, 13, 17 & 21
• The 50% marks can act as resistance/support
• The 50% marks can also show trend
- If the instrument is trading below all 50% lines, this is one indication that price will remain low or go lower.
- If the instrument is trading above all 50% lines, this is one indication that price will remain high or go higher
• The indicator can also show sentiment values, which can be found on several outside websites
- After entering both the long and short sentiment, a 10 pip bumper will appear around these sentiment numbers giving another form of support/resistance to watch for
Current limitations:
• The four hour blocks currently only work on the 5 minute candle timeframe
• The sentiment bumper size and color are fixed
Bugs?
Kindly report any issues you run into and I'll try to fix them promptly.
Thank you!
릴리즈 노트
4H-50/50 tool is a way to visualize top down analysis.• There are three boxes illustrated on the chart
- One box shows the past 4 hour time frame's high, low and center
- One box shows the past 12 hour time frame's high, low and center
- The last box is the current 4 hour time frame's high, low and center
• Four hour blocks start on specific hours 1, 5, 9, 13, 17 & 21
• The 50% marks can act as resistance/support
• The 50% marks can also show trend
- If the instrument is trading below all 50% lines, this is one indication that price will remain low or go lower.
- If the instrument is trading above all 50% lines, this is one indication that price will remain high or go higher
• The indicator can also show sentiment values, which can be found on several outside websites
- After entering both the long and short sentiment, a 10 pip bumper will appear around these sentiment numbers giving another form of support/resistance to watch for
Current limitations:
• The four hour blocks currently only work on the 5 minute candle timeframe
• The sentiment bumper size and color are fixed
Bugs?
Kindly report any issues you run into and I'll try to fix them promptly.
Thank you!
보호된 스크립트입니다
이 스크립트는 비공개 소스로 게시됩니다. 하지만 이를 자유롭게 제한 없이 사용할 수 있습니다 – 자세한 내용은 여기에서 확인하세요.
면책사항
해당 정보와 게시물은 금융, 투자, 트레이딩 또는 기타 유형의 조언이나 권장 사항으로 간주되지 않으며, 트레이딩뷰에서 제공하거나 보증하는 것이 아닙니다. 자세한 내용은 이용 약관을 참조하세요.
보호된 스크립트입니다
이 스크립트는 비공개 소스로 게시됩니다. 하지만 이를 자유롭게 제한 없이 사용할 수 있습니다 – 자세한 내용은 여기에서 확인하세요.
면책사항
해당 정보와 게시물은 금융, 투자, 트레이딩 또는 기타 유형의 조언이나 권장 사항으로 간주되지 않으며, 트레이딩뷰에서 제공하거나 보증하는 것이 아닙니다. 자세한 내용은 이용 약관을 참조하세요.