OPEN-SOURCE SCRIPT
Z-Score of RSI
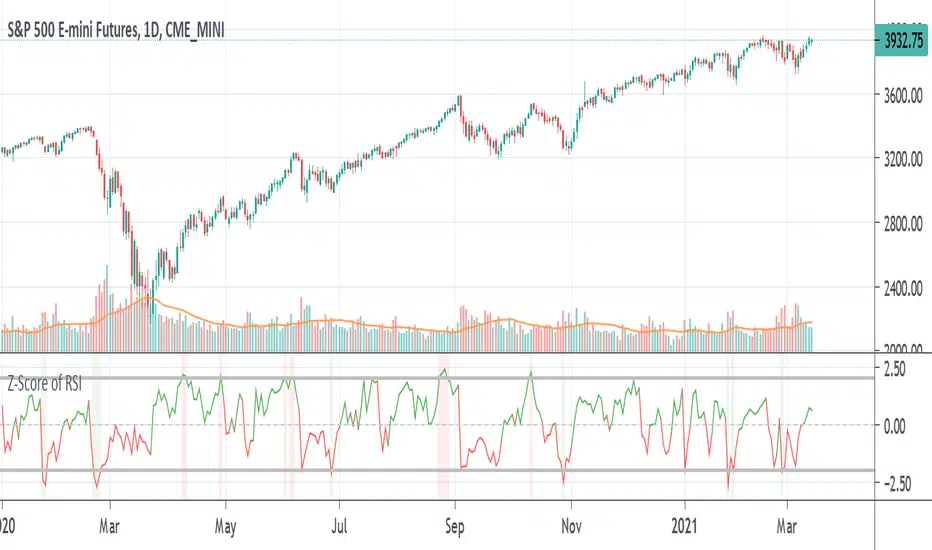
A way to see whether RSI is overbought or oversold inside its Bollinger Bands in the form of an oscillator. Z-score tells you how far the data is from the mean in terms of standard deviations. The numbers shown in the indicator are the number of standard deviations away from the average or mean. Like Bollinger Bands, if it is above the standard deviation border lines then it is considered to be outside the distribution or Bollinger Band. If it is above the upper border line then is it is overbought, if it is below the lower border line then is is oversold.
Example of how standard deviation works: 1 standard deviation contains 68% of the data, 2 SD (the default for BB) contains 95% of data, 3 SD for 99%, etc. If the data goes past that, it is considered to be outside the distribution. In statistics, data that is within the distribution is considered to be "significant".
The z-score line is colored green if it is above zero and red if it is below zero. Above zero means that the RSI is above the average line or the middle line of the Bollinger Bands, and vice-versa if it is below. A red vertical bar is shown when the the z-score is above the upper border line to show that it is overbought and a green vertical bar is shown when the z-score is below the lower border line to show that it is oversold. This is the equivalent of when the RSI is above and below its Bollinger Bands.
오픈 소스 스크립트
트레이딩뷰의 진정한 정신에 따라, 이 스크립트의 작성자는 이를 오픈소스로 공개하여 트레이더들이 기능을 검토하고 검증할 수 있도록 했습니다. 작성자에게 찬사를 보냅니다! 이 코드는 무료로 사용할 수 있지만, 코드를 재게시하는 경우 하우스 룰이 적용된다는 점을 기억하세요.
면책사항
해당 정보와 게시물은 금융, 투자, 트레이딩 또는 기타 유형의 조언이나 권장 사항으로 간주되지 않으며, 트레이딩뷰에서 제공하거나 보증하는 것이 아닙니다. 자세한 내용은 이용 약관을 참조하세요.
오픈 소스 스크립트
트레이딩뷰의 진정한 정신에 따라, 이 스크립트의 작성자는 이를 오픈소스로 공개하여 트레이더들이 기능을 검토하고 검증할 수 있도록 했습니다. 작성자에게 찬사를 보냅니다! 이 코드는 무료로 사용할 수 있지만, 코드를 재게시하는 경우 하우스 룰이 적용된다는 점을 기억하세요.
면책사항
해당 정보와 게시물은 금융, 투자, 트레이딩 또는 기타 유형의 조언이나 권장 사항으로 간주되지 않으며, 트레이딩뷰에서 제공하거나 보증하는 것이 아닙니다. 자세한 내용은 이용 약관을 참조하세요.