OPEN-SOURCE SCRIPT
Pearson Correlation Coefficient
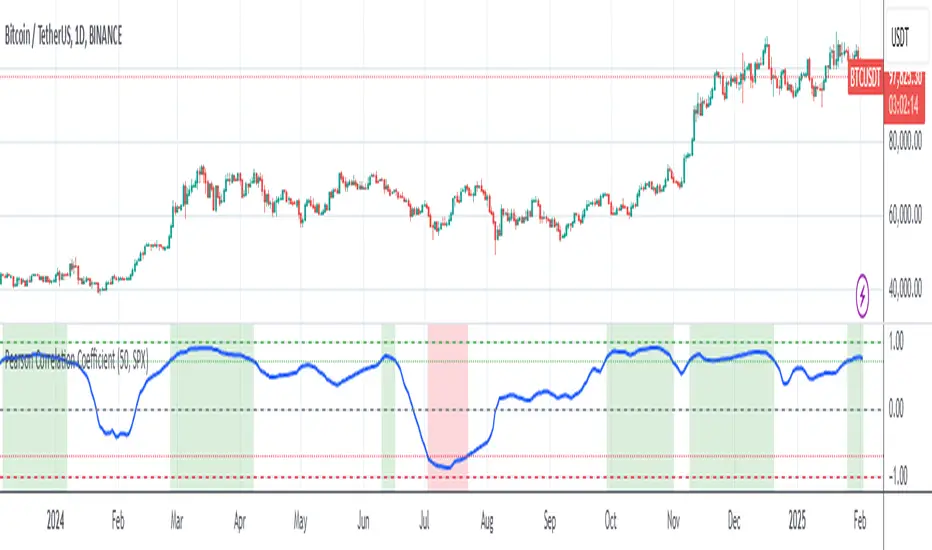
Description: The Pearson Correlation Coefficient measures the strength and direction of the linear relationship between two data series. Its value ranges from -1 to +1, where:
This measure is widely used in technical analysis to assess the degree of correlation between two financial assets. The "Pearson Correlation (Manual Compare)" indicator allows users to manually select two assets and visually display their correlation relationship on a chart.
Features:
How to Select the Second Asset:
This indicator is ideal for traders looking to identify relationships and correlations between different financial assets to make informed trading decisions.
- +1 indicates a perfect positive linear correlation: as one asset increases, the other asset increases proportionally.
- 0 indicates no linear correlation: variations in one asset have no relation to variations in the other asset.
- -1 indicates a perfect negative linear correlation: as one asset increases, the other asset decreases proportionally.
This measure is widely used in technical analysis to assess the degree of correlation between two financial assets. The "Pearson Correlation (Manual Compare)" indicator allows users to manually select two assets and visually display their correlation relationship on a chart.
Features:
- Correlation Period: The time period used for calculating the correlation can be adjusted (default: 50).
- Comparison Asset: Users can select a secondary asset for comparison.
- Visual Plots: The chart includes reference lines for perfect correlations (+1 and -1) and strong correlations (+0.7 and -0.7).
- Alerts: Set alerts for when the correlation exceeds certain threshold values (e.g., +0.7 for strong positive correlation).
How to Select the Second Asset:
- Primary Asset Selection: The primary asset is the one you select for viewing on the chart. This can be done by simply opening the chart for the desired asset.
- Secondary Asset Selection: To select the secondary asset for comparison, use the input field labeled "Comparison Asset" in the script settings. You can manually enter the ticker symbol of the secondary asset you want to compare with the primary asset.
This indicator is ideal for traders looking to identify relationships and correlations between different financial assets to make informed trading decisions.
오픈 소스 스크립트
트레이딩뷰의 진정한 정신에 따라, 이 스크립트의 작성자는 이를 오픈소스로 공개하여 트레이더들이 기능을 검토하고 검증할 수 있도록 했습니다. 작성자에게 찬사를 보냅니다! 이 코드는 무료로 사용할 수 있지만, 코드를 재게시하는 경우 하우스 룰이 적용된다는 점을 기억하세요.
면책사항
해당 정보와 게시물은 금융, 투자, 트레이딩 또는 기타 유형의 조언이나 권장 사항으로 간주되지 않으며, 트레이딩뷰에서 제공하거나 보증하는 것이 아닙니다. 자세한 내용은 이용 약관을 참조하세요.
오픈 소스 스크립트
트레이딩뷰의 진정한 정신에 따라, 이 스크립트의 작성자는 이를 오픈소스로 공개하여 트레이더들이 기능을 검토하고 검증할 수 있도록 했습니다. 작성자에게 찬사를 보냅니다! 이 코드는 무료로 사용할 수 있지만, 코드를 재게시하는 경우 하우스 룰이 적용된다는 점을 기억하세요.
면책사항
해당 정보와 게시물은 금융, 투자, 트레이딩 또는 기타 유형의 조언이나 권장 사항으로 간주되지 않으며, 트레이딩뷰에서 제공하거나 보증하는 것이 아닙니다. 자세한 내용은 이용 약관을 참조하세요.