PROTECTED SOURCE SCRIPT
업데이트됨 MONEY ZONE
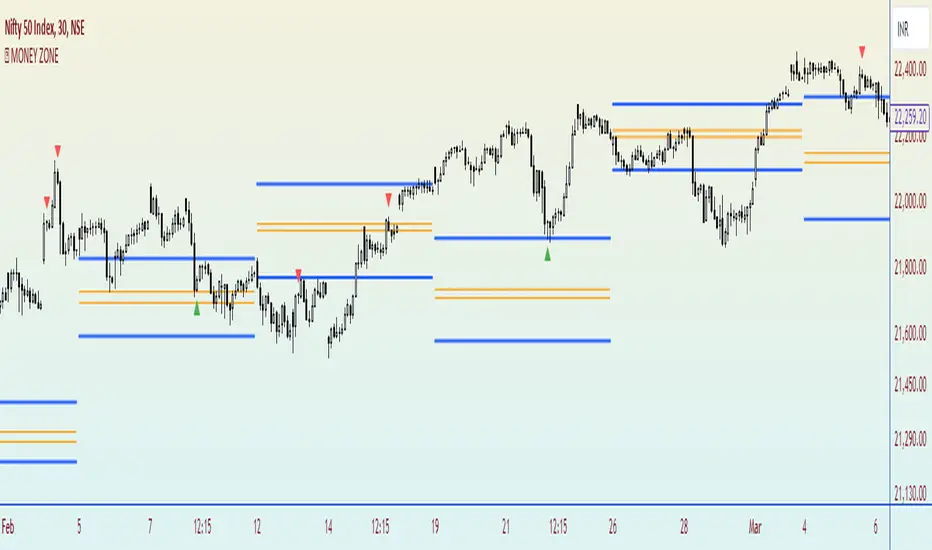
A volume profile is an advanced charting tool that displays the traded volume at different price levels over a specific period. It helps you visualize where the majority of trading activity has occurred.
This indicator is a Market Profiling tool used to analyse the Point of Control (POC) and Value Area (VAH/VAL) on the daily, weekly and monthly timeframes. It also optionally displays historical Value Areas to help find confluence with past data.
The Point of Control describes the price level where the most volume was traded. A Naked Point of Control (also called a Virgin Point of Control) is a previous POC that has not been traded.
The Value Area is a range of prices where the majority of trading volume took place on the prior trading day. In specific, this area is the range where 70% of the prior day’s volume happened. The value area is approximately one standard deviation above and below the average highest volume price. With this knowledge, there are specific probabilities of market behavior we can understand to digest the value area. The value area gives us an idea of where the smart money is playing ball and where the institutions are guiding the market. From this data, we can derive intra-day strategies that capitalize on market behavior.
🔹 Point of Control (PoC)
Point of Control (POC) – The price level for the time period with the highest traded volume
🔹 Value Area (VA)
Value Area (VA) – The range of price levels in which the specified percentage of all volume was traded during the time period.
릴리즈 노트
Bugs Removed.릴리즈 노트
Bugs fixed.릴리즈 노트
updated.릴리즈 노트
Reversal Signals printing on.릴리즈 노트
Bugs Removed As well as signals removed from the settings.릴리즈 노트
AUTO Time line improved. now can see same level above 5min chart timeframe.보호된 스크립트입니다
이 스크립트는 비공개 소스로 게시됩니다. 하지만 이를 자유롭게 제한 없이 사용할 수 있습니다 – 자세한 내용은 여기에서 확인하세요.
면책사항
해당 정보와 게시물은 금융, 투자, 트레이딩 또는 기타 유형의 조언이나 권장 사항으로 간주되지 않으며, 트레이딩뷰에서 제공하거나 보증하는 것이 아닙니다. 자세한 내용은 이용 약관을 참조하세요.
보호된 스크립트입니다
이 스크립트는 비공개 소스로 게시됩니다. 하지만 이를 자유롭게 제한 없이 사용할 수 있습니다 – 자세한 내용은 여기에서 확인하세요.
면책사항
해당 정보와 게시물은 금융, 투자, 트레이딩 또는 기타 유형의 조언이나 권장 사항으로 간주되지 않으며, 트레이딩뷰에서 제공하거나 보증하는 것이 아닙니다. 자세한 내용은 이용 약관을 참조하세요.