OPEN-SOURCE SCRIPT
Cycle Oscillator

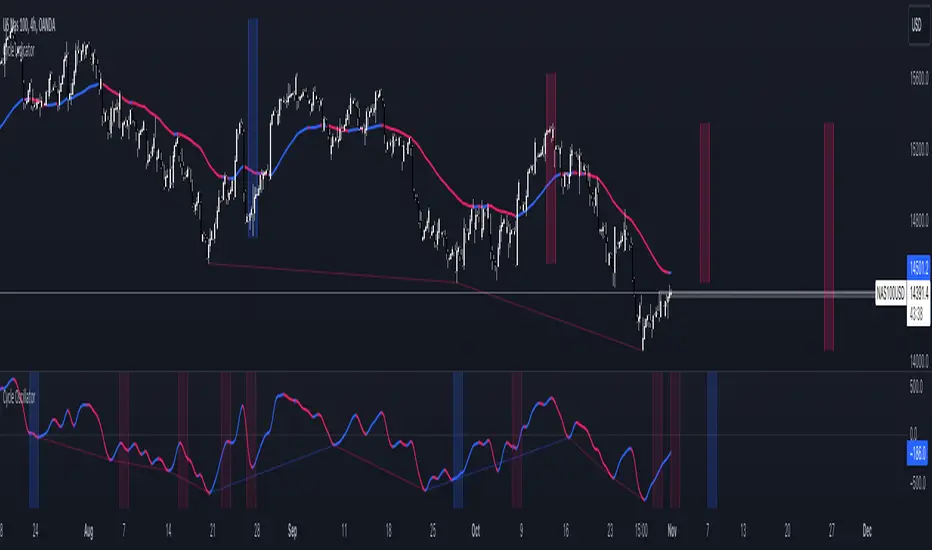
The Cycle Oscillator is a tool developed to help traders analyze market cycles thanks to a simplified version of the Hurst theory and the easy visualization provided by the detrended cycle.
This indicator has two functions:
- The first one is the plotting of a line that oscillates above and below the zero line, which can be used to find the cycle direction and momentum
- The second feature is the next-cycle bottom forecaster, useful for estimating the timing of the future pivot low based on the pivot low of the oscillator.
This last feature shows graphically the period in which the next low will probably happen, using as a calculation method the timing of the previous indicator's lows.
Additionally, the user can choose to modify the cycle length to analyze bigger or smaller price movements.
This indicator can be greatly used in combination with other Cycle Indicators to gain more confluence in the plotted time areas.
오픈 소스 스크립트
트레이딩뷰의 진정한 정신에 따라, 이 스크립트의 작성자는 이를 오픈소스로 공개하여 트레이더들이 기능을 검토하고 검증할 수 있도록 했습니다. 작성자에게 찬사를 보냅니다! 이 코드는 무료로 사용할 수 있지만, 코드를 재게시하는 경우 하우스 룰이 적용된다는 점을 기억하세요.
면책사항
해당 정보와 게시물은 금융, 투자, 트레이딩 또는 기타 유형의 조언이나 권장 사항으로 간주되지 않으며, 트레이딩뷰에서 제공하거나 보증하는 것이 아닙니다. 자세한 내용은 이용 약관을 참조하세요.
오픈 소스 스크립트
트레이딩뷰의 진정한 정신에 따라, 이 스크립트의 작성자는 이를 오픈소스로 공개하여 트레이더들이 기능을 검토하고 검증할 수 있도록 했습니다. 작성자에게 찬사를 보냅니다! 이 코드는 무료로 사용할 수 있지만, 코드를 재게시하는 경우 하우스 룰이 적용된다는 점을 기억하세요.
면책사항
해당 정보와 게시물은 금융, 투자, 트레이딩 또는 기타 유형의 조언이나 권장 사항으로 간주되지 않으며, 트레이딩뷰에서 제공하거나 보증하는 것이 아닙니다. 자세한 내용은 이용 약관을 참조하세요.