OPEN-SOURCE SCRIPT
업데이트됨 % Sensitivity MA
Modifying an existing indicator is one thing, but creating an entirely new indicator is a totally different thing that involves even more creativity!
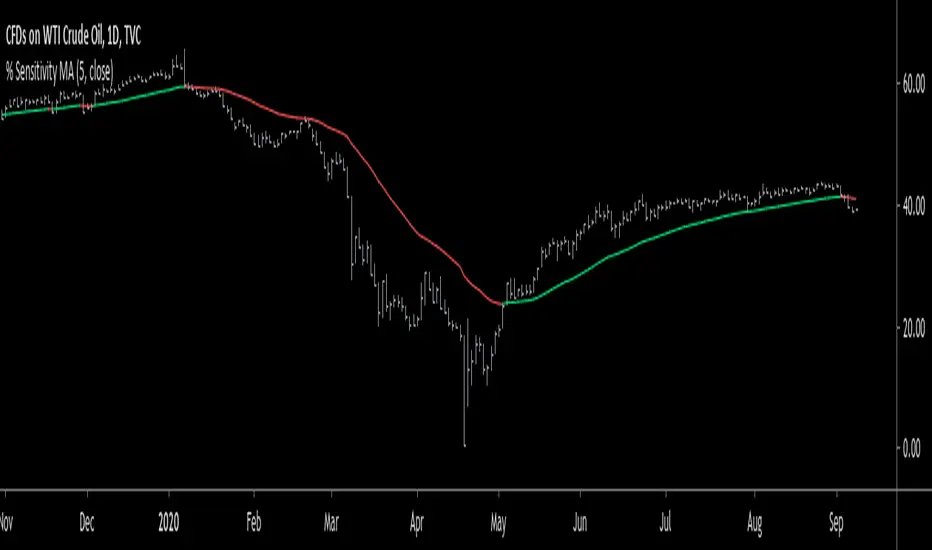
Today, I accomplished the latter by creating a brand new indicator. It's called "% Sensitivity MA". What does it do? Well, it's pretty much like any moving average, it tells you the trend. When the % Sensitivity MA is green, it's an uptrend, and vise versa for when it's red. Here's the calculation:
% Sensitivity MA (n,src) = ma.prev + (n/100) * (src - ma.prev)
where:
n - parameter that determines % sensitivity from 0 to 100.
src - parameter that determines the source. (default: close)
ma.prev - previous value of % Sensitivity MA.
Note:
- % Sensitivity MA has no parameter for lookback period.
- The n parameter is limited to a value between 0 and 100.
- Higher n values are more sensitive. (So, 100 is maximum sensitivity.)
- The value of the n parameter can have an unlimited number of decimal places. (making this indicator very precise!)
- I recommend n values closer to 0 than 100.
- For the source, I recommend closing prices.
Good luck, and enjoy!
릴리즈 노트
>>>close > ma? ---> green if true, otherwise red.
오픈 소스 스크립트
트레이딩뷰의 진정한 정신에 따라, 이 스크립트의 작성자는 이를 오픈소스로 공개하여 트레이더들이 기능을 검토하고 검증할 수 있도록 했습니다. 작성자에게 찬사를 보냅니다! 이 코드는 무료로 사용할 수 있지만, 코드를 재게시하는 경우 하우스 룰이 적용된다는 점을 기억하세요.
면책사항
해당 정보와 게시물은 금융, 투자, 트레이딩 또는 기타 유형의 조언이나 권장 사항으로 간주되지 않으며, 트레이딩뷰에서 제공하거나 보증하는 것이 아닙니다. 자세한 내용은 이용 약관을 참조하세요.
오픈 소스 스크립트
트레이딩뷰의 진정한 정신에 따라, 이 스크립트의 작성자는 이를 오픈소스로 공개하여 트레이더들이 기능을 검토하고 검증할 수 있도록 했습니다. 작성자에게 찬사를 보냅니다! 이 코드는 무료로 사용할 수 있지만, 코드를 재게시하는 경우 하우스 룰이 적용된다는 점을 기억하세요.
면책사항
해당 정보와 게시물은 금융, 투자, 트레이딩 또는 기타 유형의 조언이나 권장 사항으로 간주되지 않으며, 트레이딩뷰에서 제공하거나 보증하는 것이 아닙니다. 자세한 내용은 이용 약관을 참조하세요.