OPEN-SOURCE SCRIPT
Implied Volatility Levels
Overview:
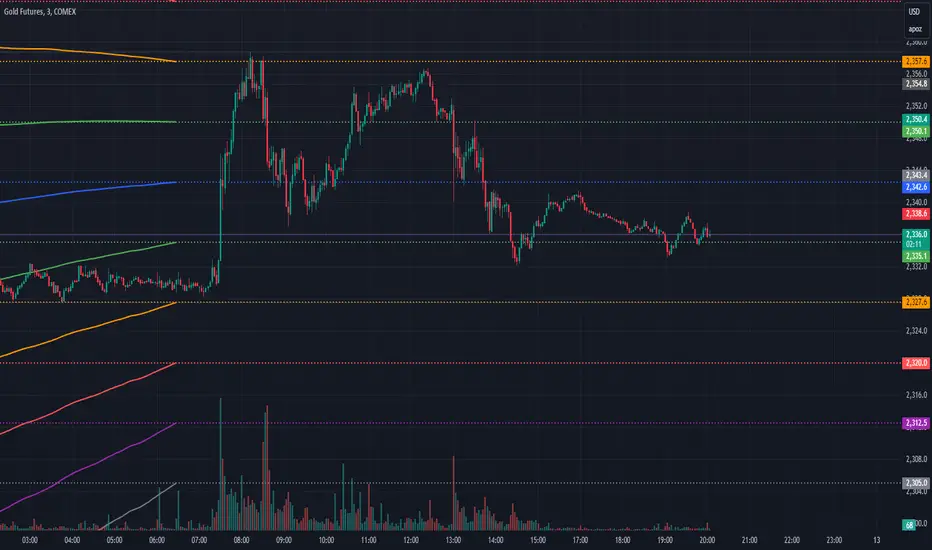
The Implied Volatility Levels Indicator is a powerful tool designed to visualize different levels of implied volatility on your trading chart. This indicator calculates various implied volatility levels based on historical price data and plots them as dynamic dotted lines, helping traders identify significant market thresholds and potential reversal points.
Features:
Multi-Level Implied Volatility: The indicator calculates and plots multiple levels of implied volatility, including the mean and both positive and negative standard deviation multiples.
Dynamic Updates: The levels update in real-time, reflecting the latest market conditions without cluttering your chart with outdated information.
Customizable Parameters: Users can adjust the lookback period and the standard deviation multiplier to tailor the indicator to their trading strategy.
Visual Clarity: Implied volatility levels are displayed using distinct colors and dotted lines, providing clear visual cues without obstructing the view of price action.
Support for Multiple Levels: Includes additional levels (up to ±5 standard deviations) for in-depth market analysis.
How It Works:
The indicator computes the standard deviation of the closing prices over a user-defined lookback period. It then calculates various implied volatility levels by adding and subtracting multiples of this standard deviation from the mean price. These levels are plotted as dotted lines on the chart, offering traders a clear view of the current market's volatility landscape.
Usage:
Identify Key Levels: Use the plotted lines to spot potential support and resistance levels based on implied volatility.
Analyze Market Volatility: Understand how volatile the market is relative to historical data.
Plan Entry and Exit Points: Make informed trading decisions by observing where the price is in relation to the implied volatility levels.
Parameters:
Lookback Period (Days): The number of days to consider for calculating historical volatility (default is 252 days).
Standard Deviation Multiplier: A multiplier to adjust the distance of the levels from the mean (default is 1.0).
This indicator is ideal for traders looking to incorporate volatility analysis into their technical strategy, providing a robust framework for anticipating market movements and potential reversals.
오픈 소스 스크립트
트레이딩뷰의 진정한 정신에 따라, 이 스크립트의 작성자는 이를 오픈소스로 공개하여 트레이더들이 기능을 검토하고 검증할 수 있도록 했습니다. 작성자에게 찬사를 보냅니다! 이 코드는 무료로 사용할 수 있지만, 코드를 재게시하는 경우 하우스 룰이 적용된다는 점을 기억하세요.
면책사항
해당 정보와 게시물은 금융, 투자, 트레이딩 또는 기타 유형의 조언이나 권장 사항으로 간주되지 않으며, 트레이딩뷰에서 제공하거나 보증하는 것이 아닙니다. 자세한 내용은 이용 약관을 참조하세요.
오픈 소스 스크립트
트레이딩뷰의 진정한 정신에 따라, 이 스크립트의 작성자는 이를 오픈소스로 공개하여 트레이더들이 기능을 검토하고 검증할 수 있도록 했습니다. 작성자에게 찬사를 보냅니다! 이 코드는 무료로 사용할 수 있지만, 코드를 재게시하는 경우 하우스 룰이 적용된다는 점을 기억하세요.
면책사항
해당 정보와 게시물은 금융, 투자, 트레이딩 또는 기타 유형의 조언이나 권장 사항으로 간주되지 않으며, 트레이딩뷰에서 제공하거나 보증하는 것이 아닙니다. 자세한 내용은 이용 약관을 참조하세요.